
Figure 4.
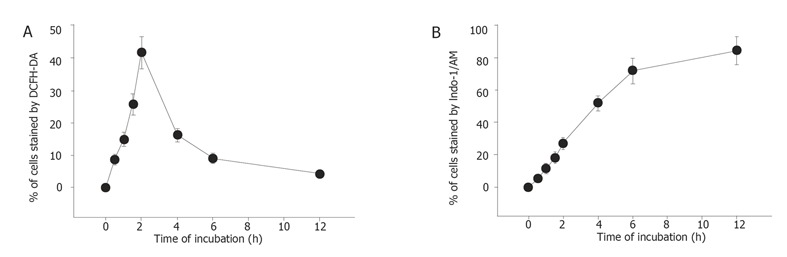
Flow cytometric analysis of reactive oxygen species (A) and Ca2+ concentration (B) in human gastric carcinoma SNU-5 cells with 100 µmol/L berberine for various time periods. The SNU-5 cells (5×10⁵ cells/mL) were treated with 100 μmol/L berberine for 0, 0.5, 1, 1.5, 2, 4, 6, and 12 h to detect the changes of ROS and Ca2+ cmcentration. The zero cancentration was defined as control. The percentage of cells stained with DCFH-DA dye was determined by flow cytometry as described in the Materials and Methods section.