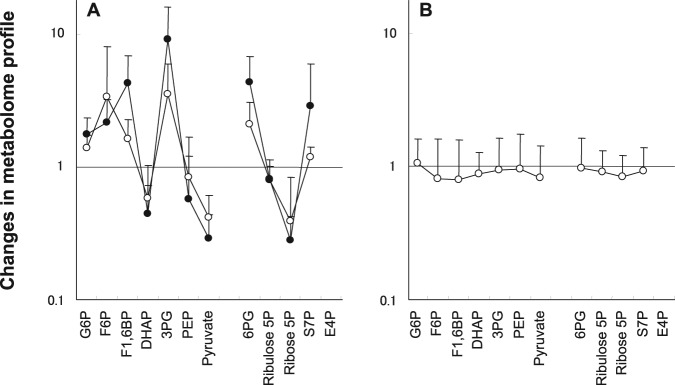
Figure 2.

Changes in metabolome profile. (A) Fluoride-glucose rinse, 10% glucose rinse after application of fluoride containing 225 ppm F− (open circle) or 900 ppm F− (closed circle); and (B) xylitol-glucose rinse, 10% xylitol rinse with 10% glucose. The rate of change was calculated as (amount of metabolite after glucose rinse with fluoride application or xylitol-glucose rinse) / (amount of metabolite after glucose rinse). Values are the mean of seven individuals. Vertical bar, standard deviation. See Fig. 1 for abbreviations of metabolites.
