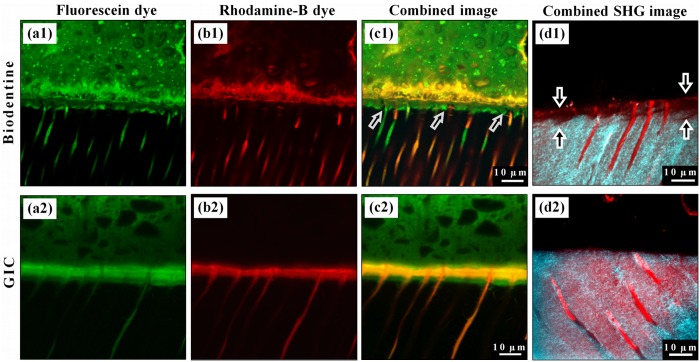
Figure 2.
Representative fluorescence-mode CLSM images for the interfaces of Biodentine and GIC cements (upper side of each image) with the dentin (lower side). (a1) Distribution of the fluorescein dye labeling the Biodentine cement shows a band of richly dye-infiltrated dentin just beneath the interface. This band cannot be seen with Rhodamine-B micro-permeability (b1), where the dye permeated through this band and diffused into the cement above the interface without any mixing with the fluorescein. This band is believed to be formed as a result of the strong alkaline effect of calcium hydroxide leaching out of the cement, and it corresponds to the MIZ. (c1) Dye-deficient areas can be seen within this zone (arrows), which represent the un-affected peritubular dentin. (a2) Fluorescein distribution in GIC samples also shows a richly dye-infiltrated dentin band, but this band was formed due to the acidic effect of GIC, which affected both intertubular and peritubular dentin. (b2) Rhodamine-B permeating from the pulp has also infiltrated this band, which diffused laterally through the affected tubular walls and mixed with the fluorescein as shown in (c2). (d1) Second-harmonic-generation (SHG) signal, originating from the intertubular collagen (cyan), is weak and almost absent in the interfacial dentin beneath the Biodentine (arrows) when superimposed over the dentin’s autofluorescence signal (red), which reflects its actual margin. Notice the preserved tubular structure of dentin in this zone, unlike the images for GIC samples (d2), where the SHG signal has the same distribution as the dentin’s autofluorescence signal.

