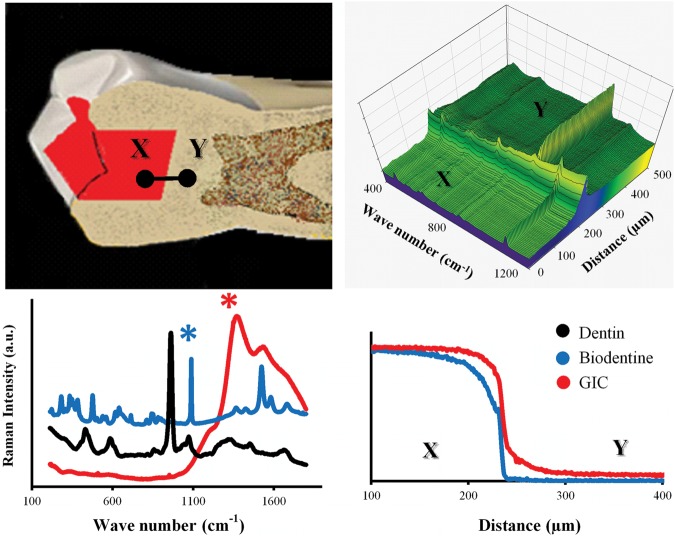
Figure 4.
(upper left) Raman area maps were obtained for the dentin-cement interface in GIC and Biodentine filled teeth by StreamLine™ scanning in the direction from points X to Y. Raman spectral maps were analyzed with curve-fitting software which averaged each area map into a single line, where each point on that line was represented by an averaged Raman spectrum (upper right). From the cements’ Raman spectra (lower left), representative characteristic peaks [1082 cm-1 and 1262 cm-1 (marked with asterisks)] were designated for Biodentine and GI cements, respectively. The average penetration depth was derived from the profiles of normalized Raman intensity of each peak, after they were generated from the curve-fitting software (lower right).

