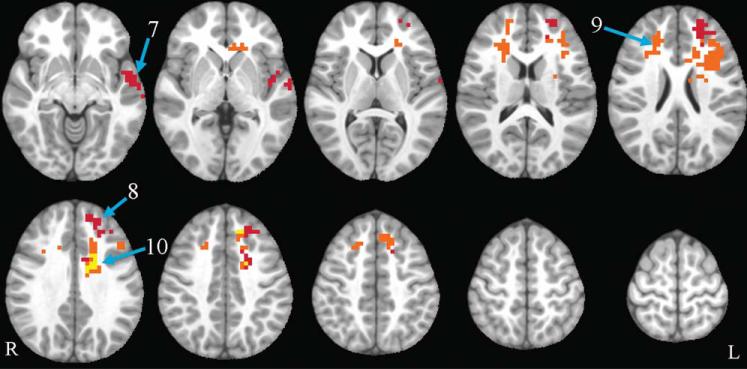
FIGURE 5.
Flanker group by time interactions. Axial slices (top left z = –8 through bottom right z = 64, spacing = 8 mm) displaying significant group by time interactions in the incongruent vs. fixation and incongruent vs. congruent contrast. All clusters shown are warm colors, indicating that the exercise group increased and the control group decreased. Red corresponds to incongruent vs. fixation, orange corresponds to incongruent vs. congruent, and yellow shows areas where the two contrasts overlap. The background anatomical image is the pediatric template that was used during alignment and is shown using radiological convention. Numbers correspond to labels in the first column of Table 3.

