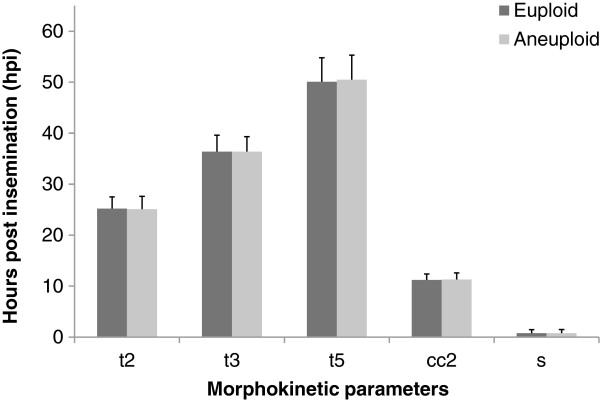
Figure 3.

Comparison of morphokinetic parameters of the early stages of embryonic development between euploid and aneuploid embryos in the time-lapse monitoring group. t2 = time from insemination to 2 cells; t3 = time from insemination to 3 cells; t5 = time from insemination to 5 cells; cc2 = time between division to 2 cells and division to 3 cells; s2 = time between division to 3 cells and subsequent division to 4 cells; hpi = hours post insemination. Morphokinetic data were presented as mean ± SD. There were no significant differences between euploid and aneuploid embryos in each of the morphokinetic parameters (p >0.05 by Mann–Whitney test).
