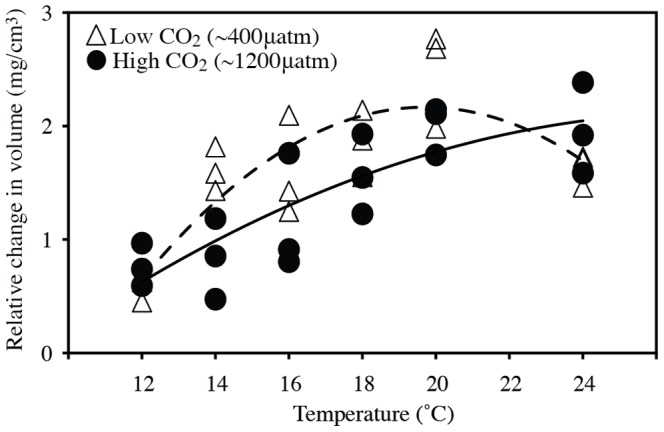
Figure 3. Thermal performance curves for each CO2 treatment.

Curves are fit by a quadratic function. Triangles = 400 µatm CO2, Circles = 1200 µatm CO2. Dotted line is the curve fit to 400 µatm, while the solid line is the curve fit to 1200 µatm. Data points represent the means of independent jars.
