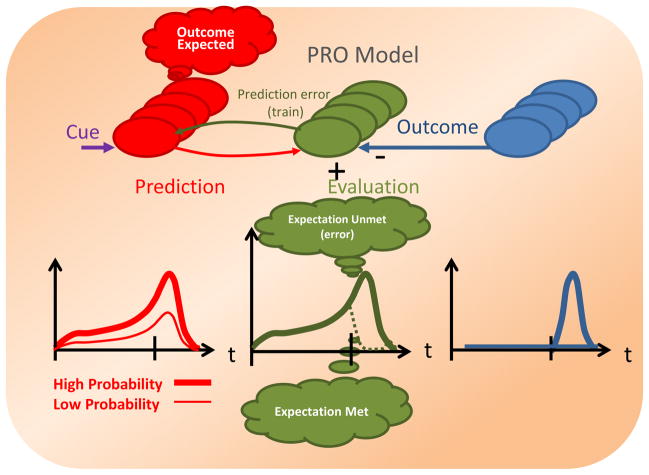
Figure 1.
A general conceptual illustration of the Predicted Response Outcome (PRO) model of anterior cingulate cortex. Left: The Prediction units (red) generate a timed prediction of what outcomes are expected, with what probability, and when. There are four Prediction units (ellipses) shown here for illustration purposes, corresponding to four predicted outcomes, although the number of Prediction units will vary in general with different tasks so that there is one Prediction unit for each corresponding possible outcome. Lower left: Greater probabilities (y-axis) are associated with greater prediction activity, which peaks at the time when the outcome is expected due to the temporal discounting of the probability. Middle: The evaluation units compute negative surprise, i.e. they detect when an expected outcome fails to occur. This is simply the difference between the predicted and actual outcomes and represents how improbable the negative surprise was. The green arc from Evaluation to Prediction indicates that prediction errors from the Evaluation units train and update the prediction signals. Lower middle: Events that are predicted with a high probability yield greater surprise signals (Expectation Unmet) when they fail to occur, but a weaker surprise signal when they do occur (Expectation met). Right: Outcomes occur (i.e. Outcome value rises rapidly and transiently to 1) or fail to occur (i.e. Outcome value is 0) at specific times.

