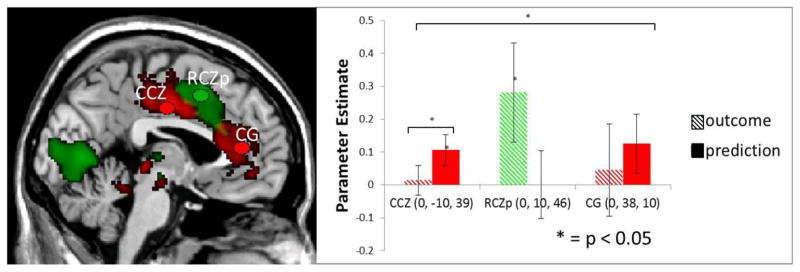
Figure 3.

Regions of the CCZ/ACC showing increased activation in response to prediction- and outcome-related effects as predicted by the PRO model, presented at a cluster corrected threshold of p < 0.05. The RCZp and CG ROIs were taken from Nee et al (2011), while the CCZ ROI was created from coordinates reported in Drabant et al (2011). Red: Prediction-related effects; Green: Outcome-related effects.
