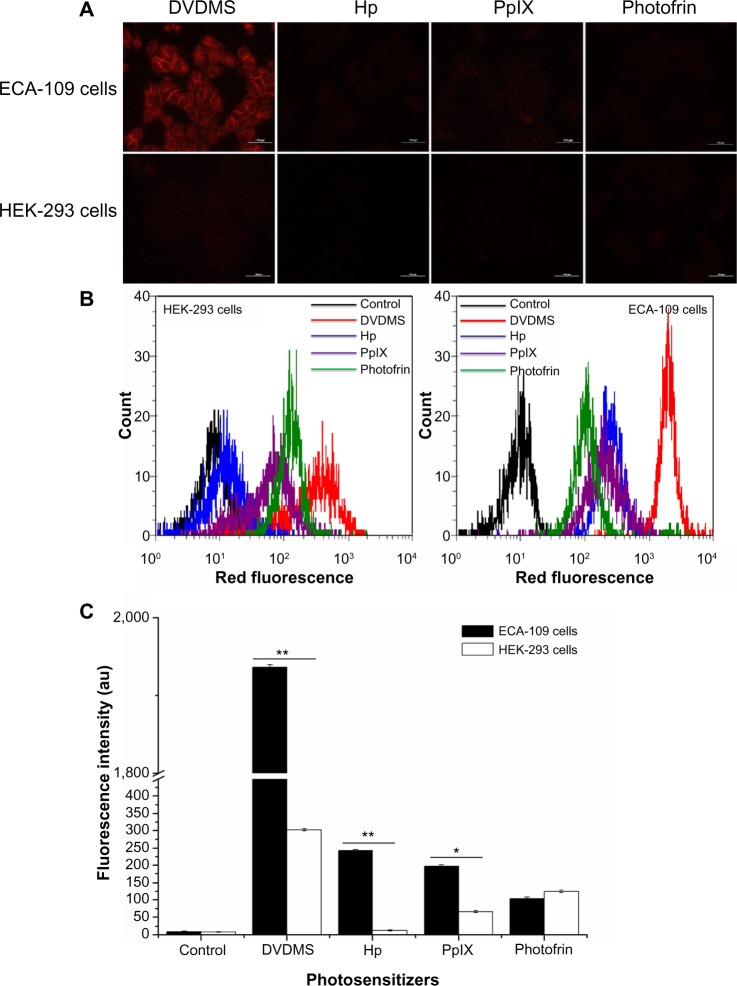
Figure 2.
Fluorescence intensity of the different photosensitizers in normal cells and cancerous cells under the same experimental conditions.
Notes: (A) Fluorescence photographs of the different sensitizers in ECA-109 cells and HEK-293 cells. (B) Measurement of fluorescence intensity by flow cytometry and (C) recorded mean fluorescence intensities. Data are presented as the mean ± standard deviation of three independent experiments. *P<0.05 and **P<0.01 between HEK-293 and ECA-109 cells.
Abbreviations: DVDMS, sinoporphyrin sodium; Hp, hematoporphyrin; PpIX, protoporphyrin IX.

