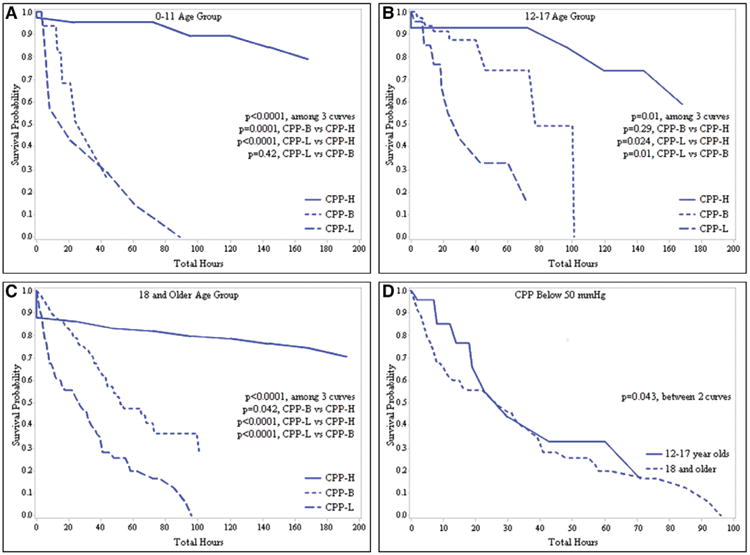
Figure 2.

A–C, Kaplan-Meier survival plots for total monitored time above the high cerebral perfusion pressure (CPP) threshold (CPP-H, continuous line), total time between CPP thresholds (CPP-B, dotted line), and total time below the low CPP threshold (CPP-L, dashed line) at each age group. CPP-H = above 40 mm Hg for 0- to 5-yr olds, above 50 mm Hg for 6- to 11-yr olds, and above 60 mm Hg for 12-yr olds and older. CPP-B = between 30 and 40 mm Hg for 0- to 5-yr olds, between 35 and 50 mm Hg for 6- to 11-yr olds, and between 50 and 60 mm Hg for 12-yr olds and older. CPP-L = below 30 mm Hg for 0- to 5-yr olds, below 35 mm Hg for 6- to 11-yr olds, and below 50 mm Hg for 12-yr olds and older. D, Kaplan-Meier survival plot for time below 50 mm Hg for the 12- to 17-yr-old age group (continuous line) and the 18-yr-old and older age group (dashed line).
