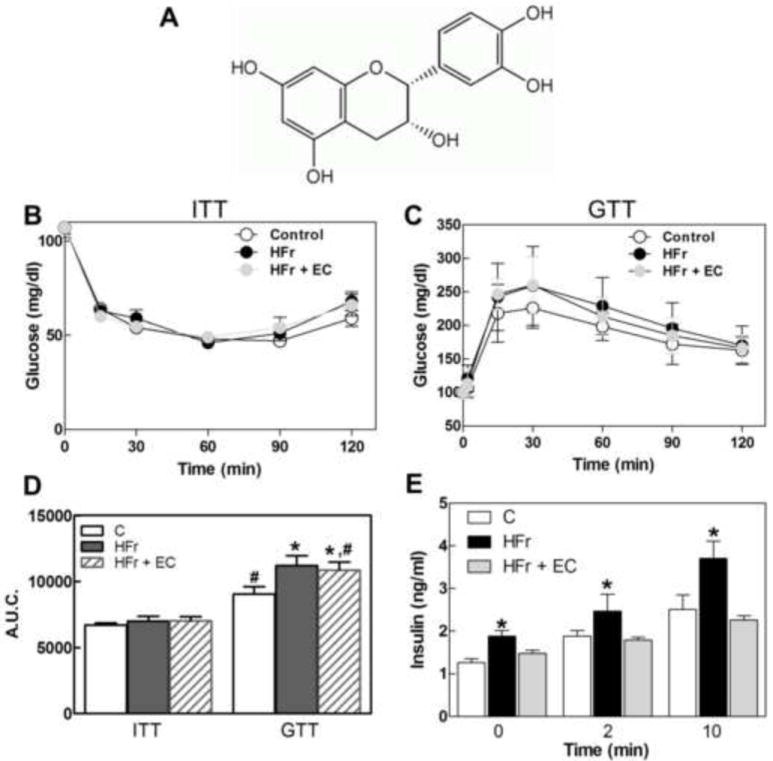
Figure 1. Effects of EC supplementation on metabolic parameters in HFr-fed rats.

A- (-)-Epicatechin chemical structure, B- ITT, C-GTT, D- Area under the curve from ITT and GTT performed on week 7 on the respective treatments, and E-plasma insulin concentration during GTT in rats fed control diet and regular drinking water (empty circles and empty bars), a control diet and drinking water supplemented with 10% (w/v) fructose (black circles and black bars), or a diet supplemented with 20 mg EC/kg body weight and fructose-containing drinking water (grey circles and grey bars). Results are shown as means ± SE and are the average of 8 animals/group. D- Values having different symbols (*,#) are significantly different; E- *are significantly different from the other groups at the corresponding time points; (p < 0.05, one way ANOVA).
