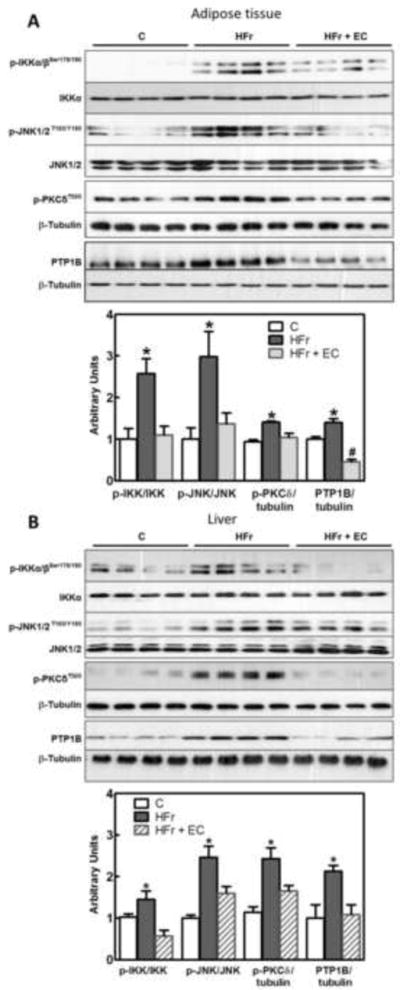
Figure 3. Effects of EC supplementation on epididymal adipose and liver tissue insulin signaling in HFr-fed rats: inhibitory signaling.

A,B- Phosphorylation of IKKα/β (Ser178/180, JNK (Thr183, Tyr185) and PKCδ (Thr505), and PTP-1B protein levels in epididymal adipose tissue (A) and liver (B) after 8 weeks on the corresponding diets. Bands were quantified and results for the HFr (HF) and HFr + EC (EC) were referred to control group values (C). Results are expressed referred to either total protein or β-tubulin levels. Results are shown as mean ± SEM of 8 animals/treatment. *, # are significantly different from all other groups (p<0.05, one way ANOVA test);
