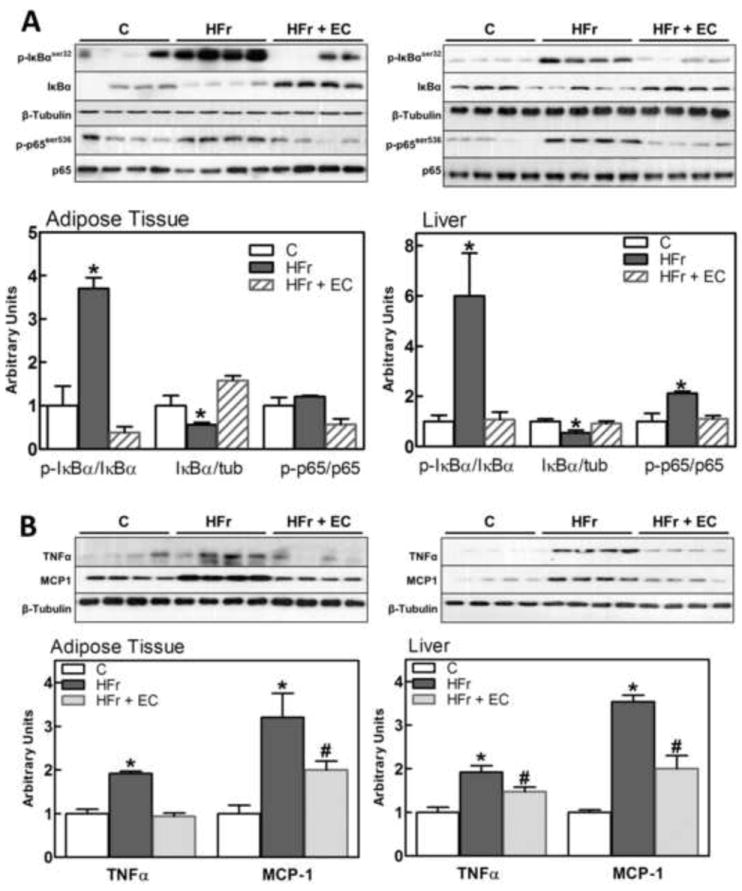
Figure 5. Effects of EC supplementation on epididymal adipose and liver tissue activation of the pro-inflammatory NF-κB signaling pathway.

Different steps in the NF-κB pathway were evaluated in rat epididymal adipose tissue and liver after 8 weeks on the corresponding diets, measuring: A- phosphorylation (Ser32) and total levels of IκBα, and phosphorylation of p65 (Ser536); B- TNFα and MCP-1 (NF-κB target genes) protein levels. Bands were quantified and results for the HFr (HF) and HFr + EC (EC) were referred to control group values (C). Results are shown as mean ± SEM of 5 animals/treatment. *,# are significantly different from the untreated controls, and are significantly different among them. (p<0.05, one way ANOVA test).
