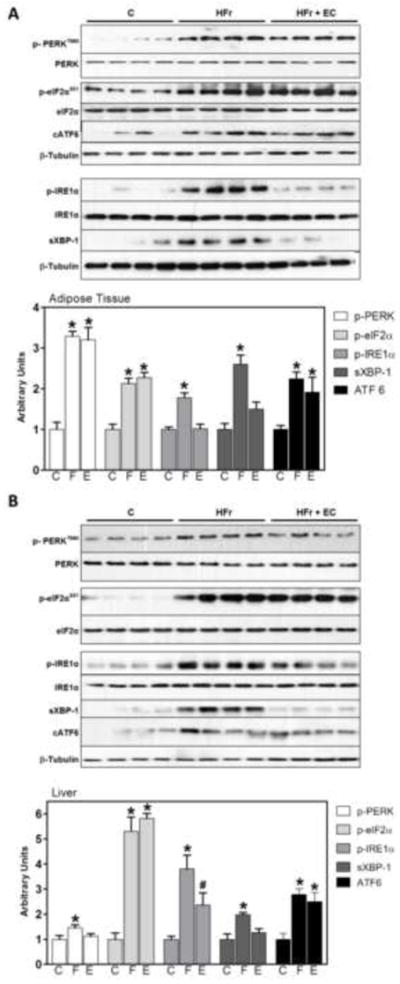
Figure 6. Effects of EC supplementation on parameters of ER stress in epididymal adipose tissue and liver.

The three branches of the UPR response were evaluated by Western blot measuring PERK (Tyr980), eIF2α (Ser51), and IRE1α (Ser724) phosphorylation, sXBP-1 and cleaved ATF6 (cATF6) in A- adipose tissue and B- liver. Bands were quantified and results for the HFr (HF) and HFr + EC (EC) were referred to control group values (C). Phosphorylated/total ratios were calculated for PERK, eIFα and IRE1α; sXBP-1 and cATF6 were normalized to tubulin content. Results are shown as mean ± SEM of 5-8 animals/treatment. *Significantly different from other groups (p<0.05, one way ANOVA test).
