Figure 7.

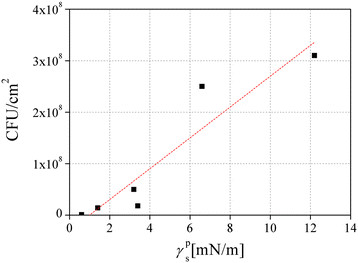
The trend between the CFU/cm 2 and polarity. Bacterial concentration values plotted as a function of the polar surface energy component. The line is not a theoretical fit but has been included in order to demonstrate the trend.

The trend between the CFU/cm 2 and polarity. Bacterial concentration values plotted as a function of the polar surface energy component. The line is not a theoretical fit but has been included in order to demonstrate the trend.