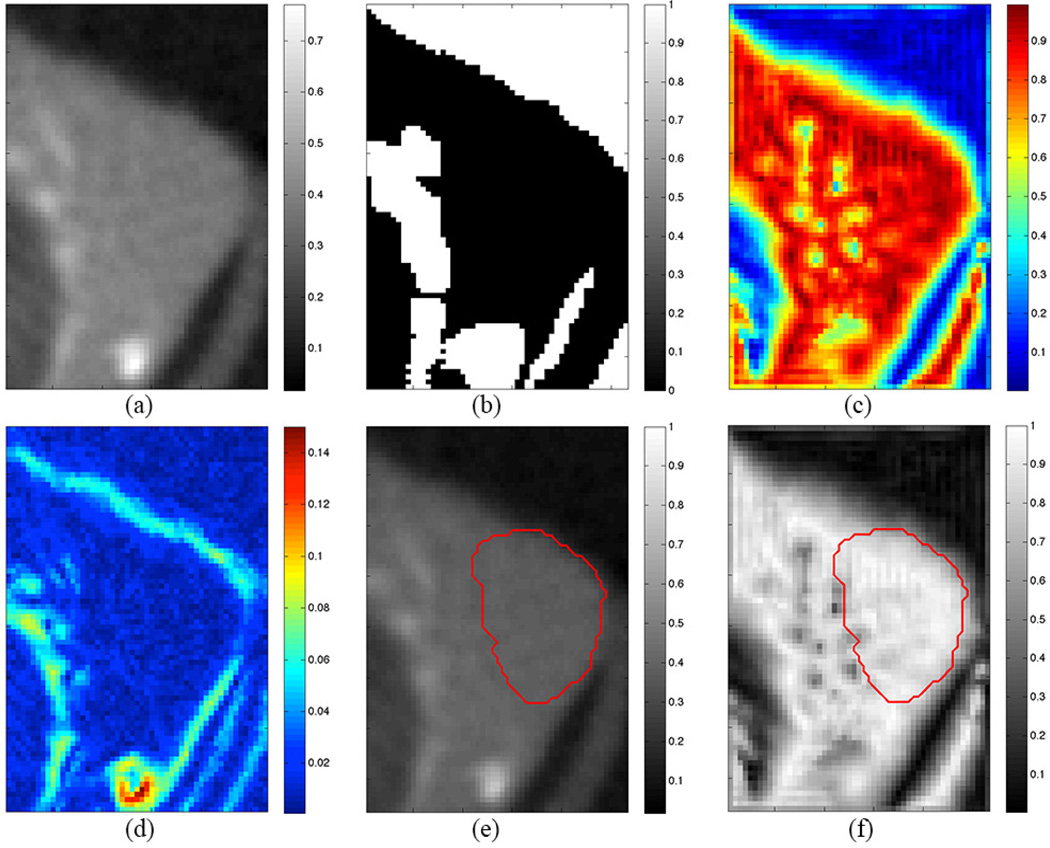
Figure 2.
(a) Axial microCT slice of subcutaneous tumor. (b) Exclusion map highlighting air and bone (white regions). (c) Local phase map highlighting faint boundary features (yellow spots). (d) Gradient map. (e,f) Segmentation result from algorithm (red contour) superimposed on microCT image (e) and local phase map (f).

