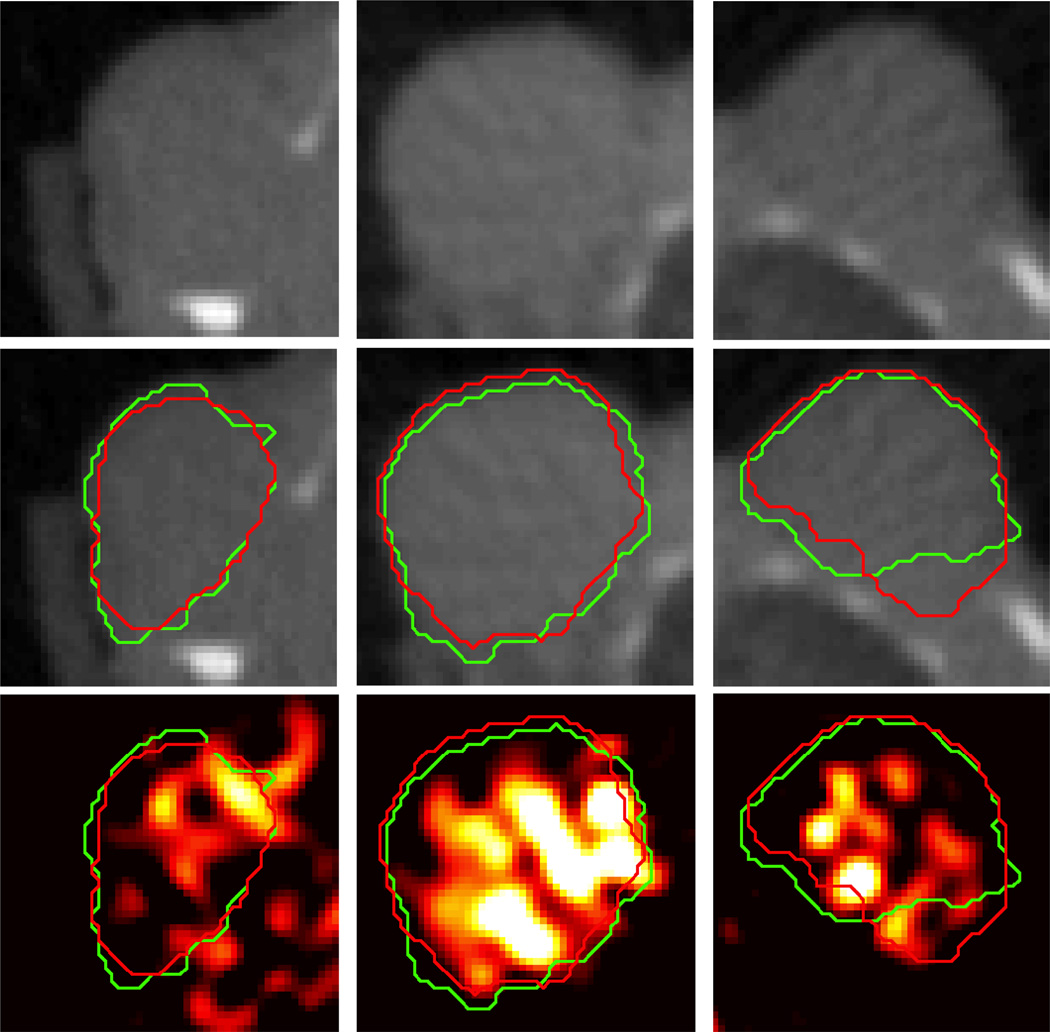
Figure 8.
Comparison between segmentation results (red contour) against manual segmentations (green contour) and tumor PET tracer uptake for three different A549 subcutaneous tumors (one per column). Top row shows axial microCT slices of the tumor. Middle row shows the same slice with the segmentation contours superimposed. Bottom row shows co-registered PET image of 18F-EF5 uptake in the tumors, with segmentation contours superimposed.

