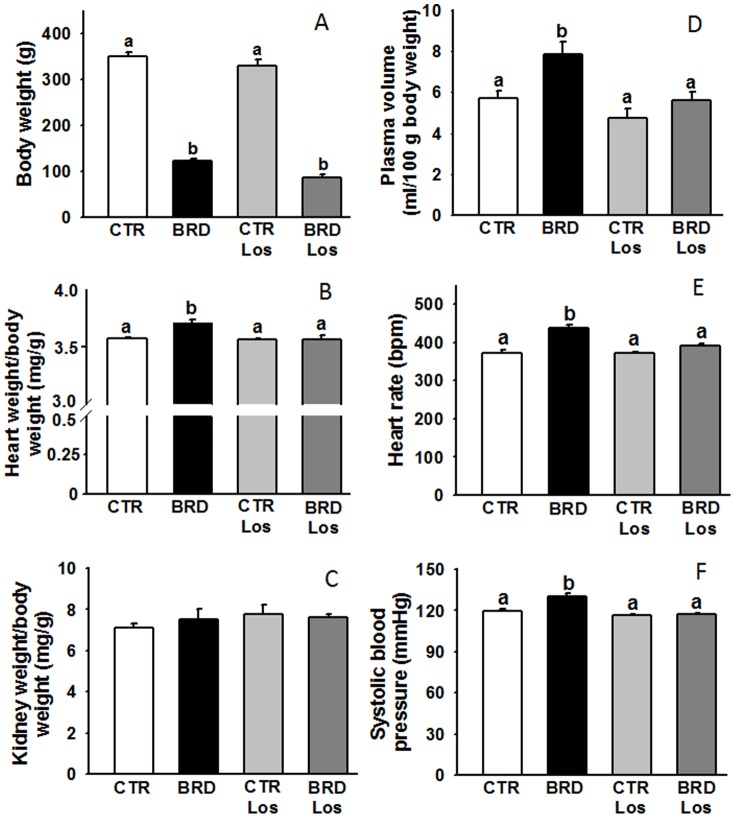
Figure 2. Alterations in body weight, cardiac index and renal index (A–C), and expanded plasma volume, accelerated heart rate and increased systolic pressure (D–F), in rats subjected to protein restriction (aged 90 days).
The animal groups were: control (CTR); fed with the deficient diet after weaning (BRD); control receiving Losartan (CTR Los); and BRD receiving Losartan (BRD Los) (A–C, n = 7; D, n = 13 in CTR and CTR Los groups; n = 5 in BRD and BRD Los groups; E, n = 23 in CTR and CTR Los groups; n = 8 in BRD and BRD Los groups; F, n = 7 in all groups). Histograms show mean ± SEM. Different lower-case letters above the bars indicate statistically significant differences in mean values within the corresponding panel (P<0.05).

