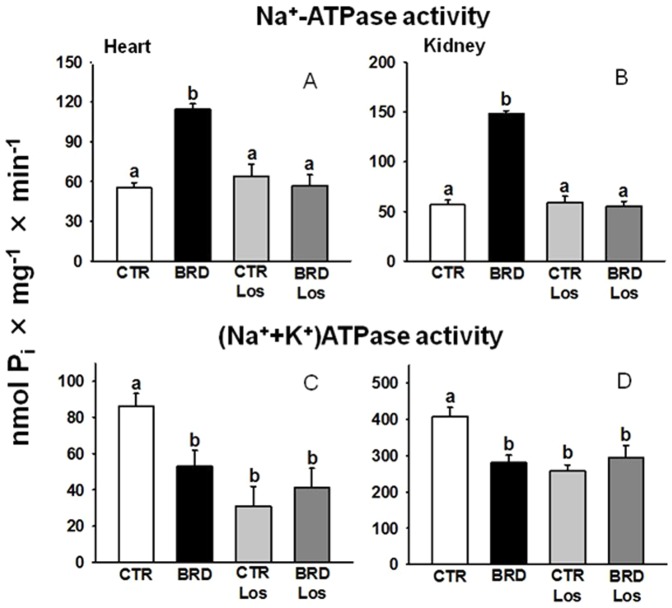
Figure 9. The increment of ouabain-resistant Na+-ATPase and the decrease of (Na++K+)ATPase activities were similar in cardiomyocytes and renal proximal tubule cells of BRD rats, but the pumps were differentially modulated by Los.
Upper: ouabain-insensitive Na+-ATPase (A, heart, n = 5; B, kidney, n = 5). Lower: (Na++K+)ATPase (C, heart, n = 5; D, kidney, n = 5). Histograms show mean ± SEM. Different lowercase letters above the bars indicate statistically different mean values within the corresponding panel (P<0.05), assessed by one-way ANOVA followed by Tukey test for multiple comparisons.

