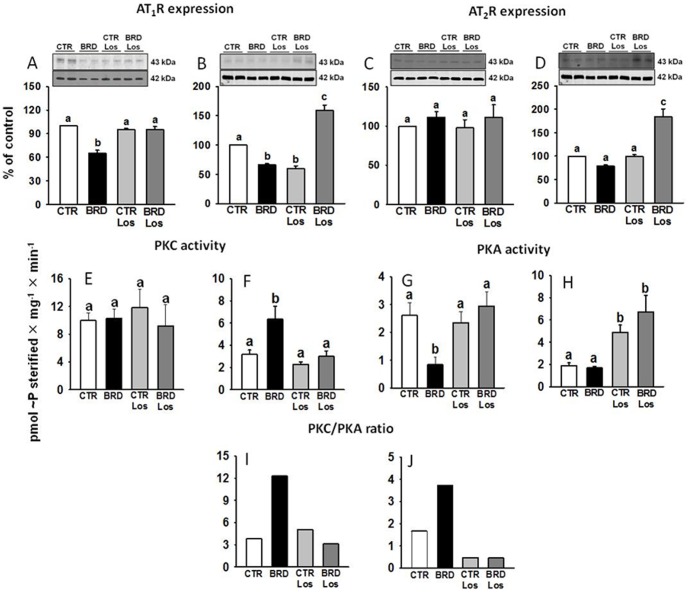
Figure 10. Chronic BRD intake altered Ang II receptor density in membranes and PKC and PKA activities.
(A–D) AT1R and AT2R density. Upper panels: representative immunostainings (duplicates for each experimental condition) and densitometric representations (lower panels) of 7–12 experiments in duplicate corrected for protein loading (β-actin immunosignals in the corresponding lane, middle panels), which were carried out using different membrane preparations (left panels: heart; right panels: kidney). Different lowercase letters above the bars indicate statistically different mean values within the corresponding panel, assessed by one-way ANOVA followed by Tukey test for multiple comparisons. P values for AT1R comparisons: P<0.001 (BRD against the other three groups in heart, P = 0.607–1.000 when the other groups were compared among them); P<0.001 (BRD and CTR Los against the other two groups in kidney, P<0.001 BRD Los against the other three groups, P = 0.811 BRD versus CTR Los). P values for AT2R comparisons: P = 0.686 (heart, where differences among the four groups were not found and Tukey test was not carried out); P<0.001 (BRD against the other three groups in kidney, P = 0.317–1.000 when the other groups were compared among them). (E–J) PKC and PKA activities (n = 5–7), and PKC/PKA ratio (left panels: heart; right panels: kidney). Different lowercase letters above the bars indicate statistically different mean values within the corresponding panel, also assessed by one-way ANOVA followed by Tukey test.

