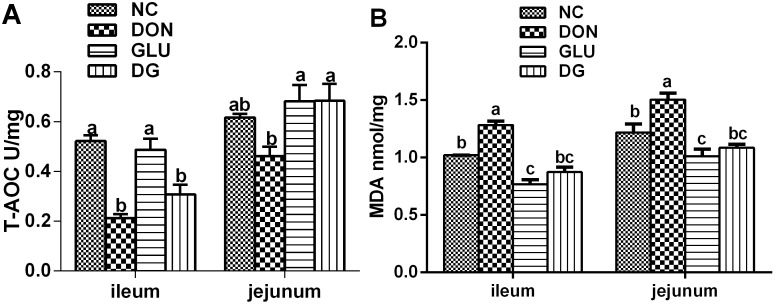
Figure 3. Ileum and jejunum anti-oxidative capacity in each group.
A: T-AOC of ileum and jejunum in each group. B: MDA concentrations of ileum and jejunum in each group. Dietary treatments were NC, an uncontaminated basal diet, DON, the basal contaminated with 4 mg/kg deoxynivalenol, GLU, uncontaminated basal diet with 2% (g/g) glutamic acid supplementation, and DG, deoxynivalenol-contaminated (4 mg/kg) basal diet with 2% glutamic acid supplementation. Data are presented as means ± SEM, n = 7, with a–c used to indicate a statistically significant difference (P<0.05, one way ANOVA method). MDA: methane dicarboxylic aldehyde (nmol/ml); T-AOC: total antioxidant capacity (U/mg).

