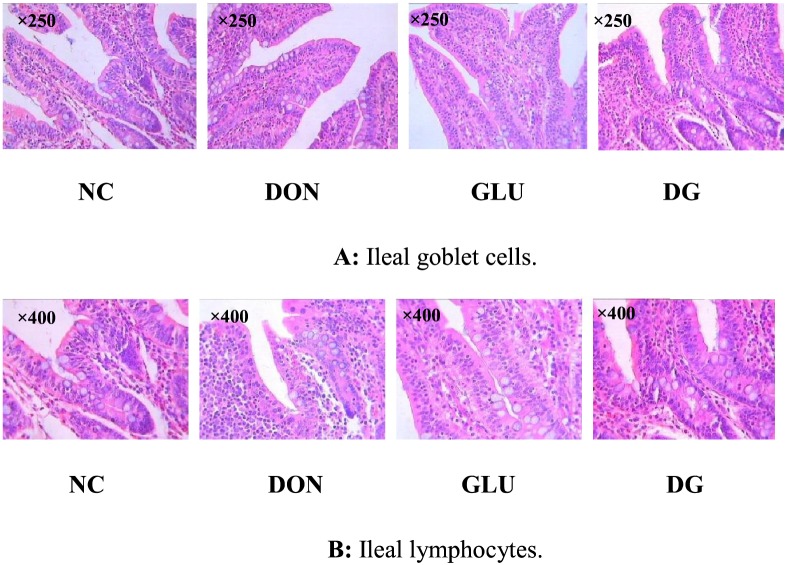
Figure 5. Image of ileal goblet cells and ileal lymphocytes.
A: Ileal goblet cells (×250). B: Ileam lymphocytes (×400). Dietary treatments were NC, an uncontaminated basal diet, DON, the basal contaminated with 4 mg/kg deoxynivalenol, GLU, uncontaminated basal diet with 2% (g/g) glutamic acid supplementation, and DG, deoxynivalenol-contaminated (4 mg/kg) basal diet with 2% (g/g) glutamic acid supplementation. n = 7 for treatments.

