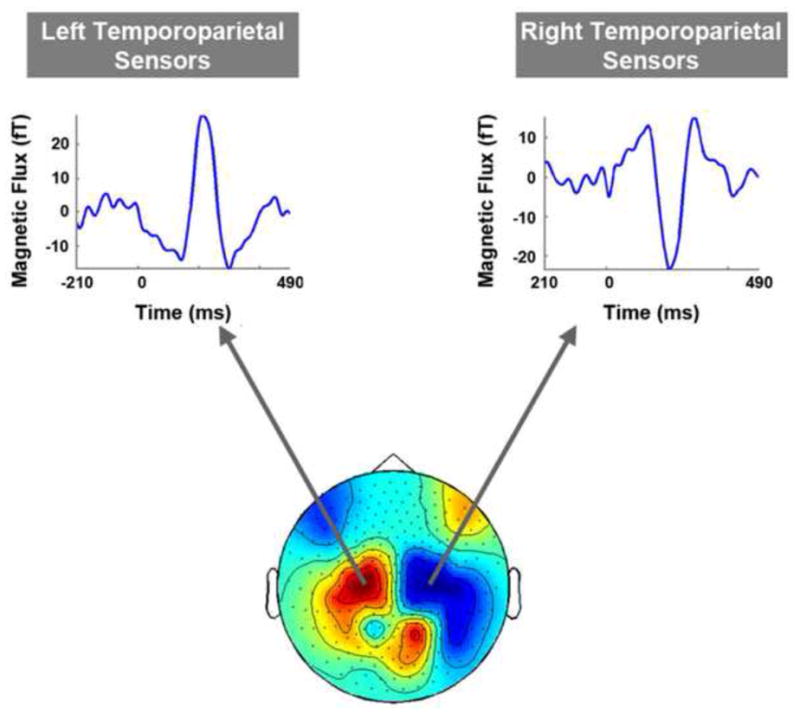
Figure 3. Topographical Plot of the Grand-Averaged Event Related Field Pattern Recorded during the peak of the middle ERF.

Left and right temporo-parietal sensors were robustly activated during the selected time point. Both sensor groups showed three main event related fields (ERFs) - early, middle and late- with the middle response having the largest peak amplitude. Each time series data trace is from one MEG sensor that is representative of the sensor group form which it was selected. The selected time point approximates the peak latency of the middle ERF recorded in right and left temporo-parietal sensors for data averaged across all subjects.
