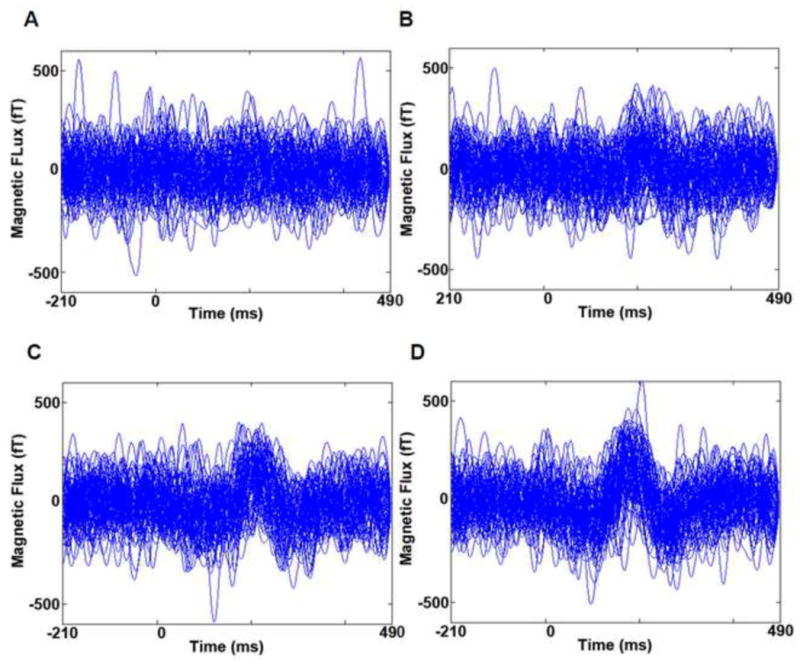
Figure 7. Neuromagnetic Responses Recorded for Single Trials of Each Trial Type.

Each trace shows time series data from one single trial (per trial type) recorded in the left temporo-parital sensor group for subject 1. These data are representative of the single trial, neuromagnetic responses seen for right temporo-parietal sensors for Subject 1. A total of 89 single trials are shown per condition. A. Single trial responses for ½ threshold duration stimuli that were incorectly identified. Traces do not show consistant differences from the prestimulus period (i.e. evoked responses are largely absent). B. Single trial responses for threshold duration stimuli that were incorrectly identified. Tracres show the emergence of an evoked response that peaks at ~210 ms post stimulus with considerable intertrial latency jitter. C. Single trial responses for threshold duration stimuli that were correctly identified. Tracres show an evoked response peaking at ~210 ms with an intermediate level of intertrial latency jiter. D. Single trial responses for 100 ms duration stimuli that were correctly identified. Tracres show an evoked response peaking at ~210 ms with very little intertrial latency jitter.
