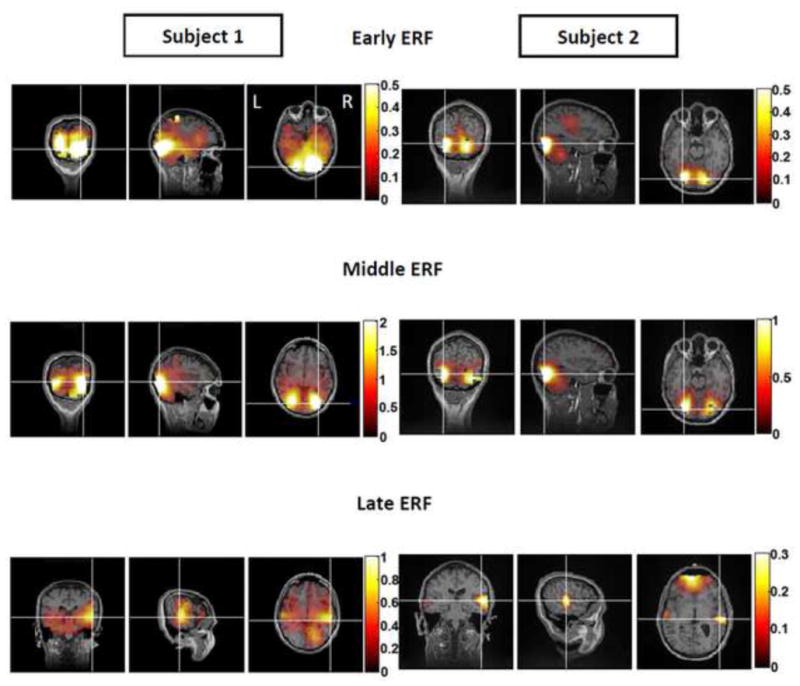
Figure 8. Localizations of Early, Middle and Late ERFs for Two Representative Subjects.

For each ERF, coronal, sagittal and axial views (left to right) of source localizations are shown for two subjects displaying similar areas of activation for early and middle evoked responses. Source activity was calculated as the decibel increase in power above noise (noise = activity recorded during the pre-stimulus period). Cross hairs represent areas of maximal power increase. Left (‘L’) and right (‘R’) cortical hemispheres are depicted in the axial view of the early ERF source localization result for subject 1. The early ERF localized mainly to medial, posterior occipital cortices in both brain hemispheres for three out of six subjects. The remaining three subjects showed more variable results. The middle ERF localized primarily to lateral occipital cortices in both brain hemispheres for the same three subjects with similar results seen for the early response. The remaining three subjects again showed greater variation in areas of activation. The late ERF localized primarily to the right, lateral occipital cortex and also incorporated activation of the anterior regions of inferior occipitotemporal cortex bilaterally for subject 1. For Subject 2, areas of activation were limited to anterior regions of occipitotemporal cortex with additional frontal lobe involvement. The late evoked response was associated with the highest level of individual variations in resulting localizations. The post-stimulus time windows used for localizing the early middle and late ERFs for subjects 1 and 2 were: subject 1— early response: 30–130 ms; subject 2— early response: 60–120 ms; subject 1— middle response: 130–270 ms; subject 2— middle response: 130–200 ms; subject 1— late response: 270–330 ms and subject 2— late response : 230 – 290 ms.
