
Extended Data Figure 5. cGAS mechanistic studies.
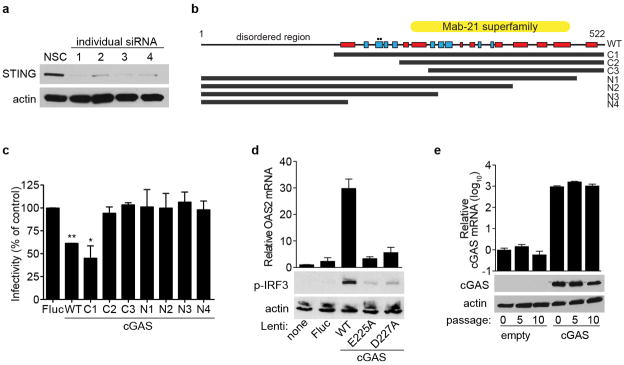
a, STAT1−/− fibroblasts were transfected with individual siRNAs targeting STING. Cell lysates were processed 48 h after transfection for western blot with anti-STING- or anti-actin-specific antibodies. From these results, siRNA no. 1 was chosen for additional studies. b, Schematic of cGAS protein sequence and truncation mutants. Red box, α-helix; blue box, β-sheet. Circles denote catalytic residues E225A and D227A. c, STAT1−/− fibroblasts were transduced with lentivirus expressing control or cGAS (wild type and truncation mutants). Cells were infected 48 h after transduction with VEEV-GFP and infectivity was monitored by FACS. Data represent the mean of two independent experiments. Error bars represent s.d. Statistical significance was determined by one-way ANOVA. *P <0.05, **P <0.01. d, STAT1−/− fibroblasts were transduced with lentivirus expressing control or cGAS (wild type and mutants). Cells were collected 48 h after transduction and total RNA was analysed for OAS2 mRNA induction relative to RPS11 (top), or protein lysates were analysed for phospho-IRF3 and actin expression by western blot (bottom). e, STAT1−/− fibroblasts were transduced with a puromycin-selectable lentivirus expressing cGAS and placed under selection. At various passages, cells were collected and total RNA was analysed for OAS2 mRNA induction relative to RPS11 (top), or protein lysates were analysed for cGAS and actin expression by western blot (bottom). Western blot and cGAS mRNA data represent one of two independent experiments, each showing similar results. OAS2 mRNA data are presented as the average of two independent experiments, each performed in triplicate. Error bars represent s.d.