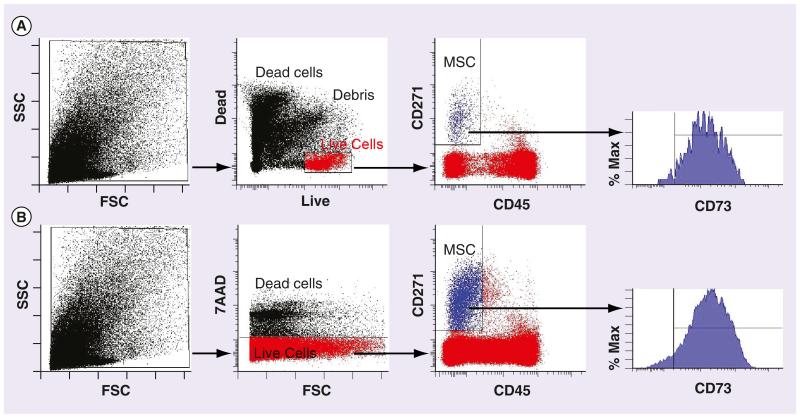
Figure 4. Analysis of CD45−CD271+ multipotential stromal cell abundance in femoral head bone digests.
(A) New live/dead binding dyes compared with (B) a traditional 7-AAD-based method. Far left panels: dot plots showing size distribution of all events (cells and debris). Middle left panels: gating on live cells (shown in red). Middle right panels: identification of CD45−CD271+ MSCs (shown in blue). Far right panels: histogram of CD73 positivity on the CD45−CD271+ MSC population. Vertical lines indicate the boundary for isotype control binding, horizontal lines indicate the region used to calculate the proportions of CD73+ cells.
MSC: Multipotential stromal cell; FSC: Forward scatter; SSC: Side scatter.

