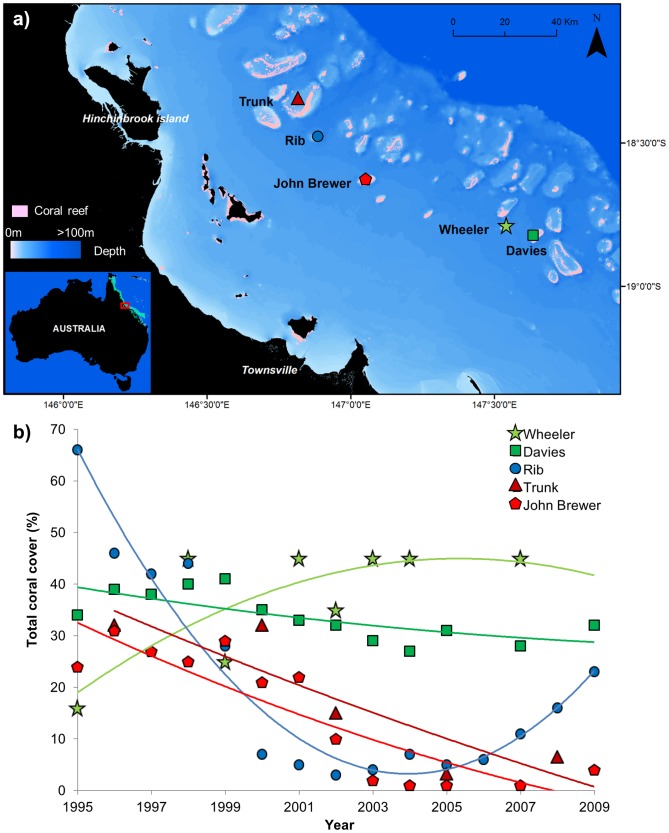
Figure 1. Location of studied reefs and historical patterns of coral cover through time.
a) Map of the surveyed reefs. The green dots are the undisturbed reefs, the red dots are the disturbed reefs that did not recover, and the blue dot is the disturbed reef that recovered. b) Coral cover (%) estimates from the 5 reefs from 1995 to 2009 providing the disturbance history context for the spatial data collected in this study. Data for Trunk reef are from Pratchett et al. [40], and for Wheeler, Davies, Rib and John Brewer reefs are from the AIMS Long Term Monitoring Program [41].

