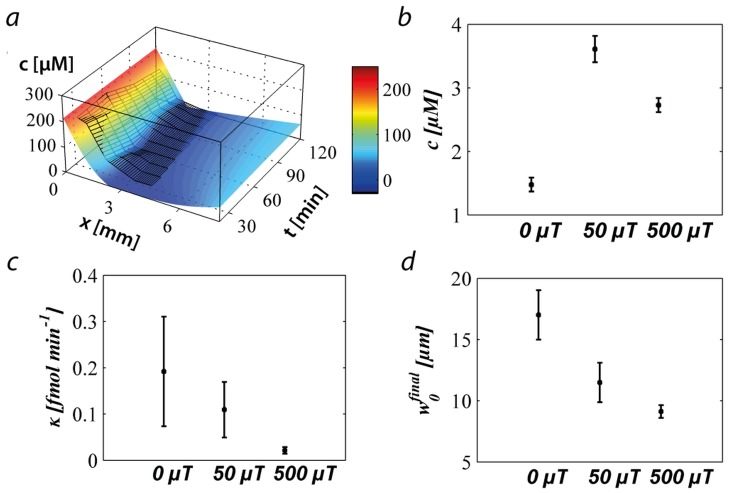
Figure 2. Output of the modified oxygen-diffusion model fitted to the experimental results: (a) Data of the first experiment shown in Figure 1 (black mesh) and the corresponding best fit obtained by solving equation 1 (See also Figure S8); (b) the oxygen concentration average at which the bacteria are localised; (c) the average consumption rate of a bacterium; (d) the final width of the aerotactic band.
Panels (b), (c), and (d) are values averaged over three experiments performed on three different days. Each day three experiments were performed, one with no magnetic field, one with a magnetic field of 50 µT parallel to the gradient, and one with a magnetic field of 500 µT parallel to the gradient.

