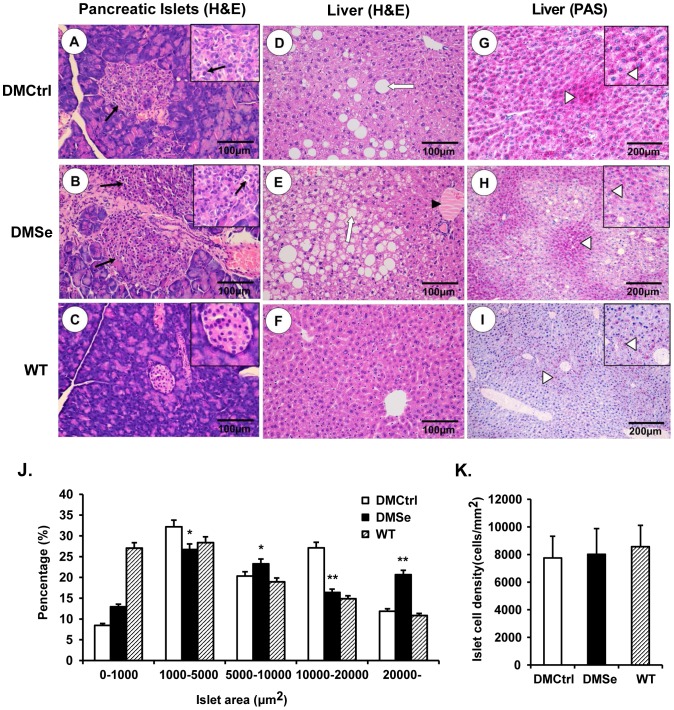
Figure 2. Histological analysis of pathological changes in the pancreas and liver.
Compared with the results from the DMCtrl group (A), the pancreatic islets of selenate-treated DMSe mice (B) increased in size. Occasional capillary congestion and islet cell necrosis (black arrows) was observed. (C) Pancreatic islets of WT mice were shaped regularly and arranged evenly. (D) Modest fatty liver degeneration and vacuolization was observed in the DMCtrl control group, but (E) this was exacerbated after selenate treatment and was accompanied by a large number of swollen hepatocytes and lipid vacuoles (white arrows). Steatosis and hepatic cord congestion (black triangles) were also present. (F) There were no abnormal lesions in the liver tissue of WT mice. (H) PAS staining for hepatic glycogen (purple-reddish granules, white triangles) revealed a reduced capacity for glycogen storage, along with increased fatty liver damage in DMSe mice compared with (G) that in DMCtrl mice. (I) There were occasional purple-reddish glycogen granules in the liver tissue of WT mice. Changes in islet area (J) and islet cell density (K) were measured and calculated using Image-Pro Plus software v. 6.0 (Media Cybernetics, Washington, USA) from more than 100 randomly selected islets in five fields from each pancreatic slice from each experimental group. The asterisk (*) represents significant differences (*P<0.05, **P<0.01) between the DMSe group and DMCtrl group.

