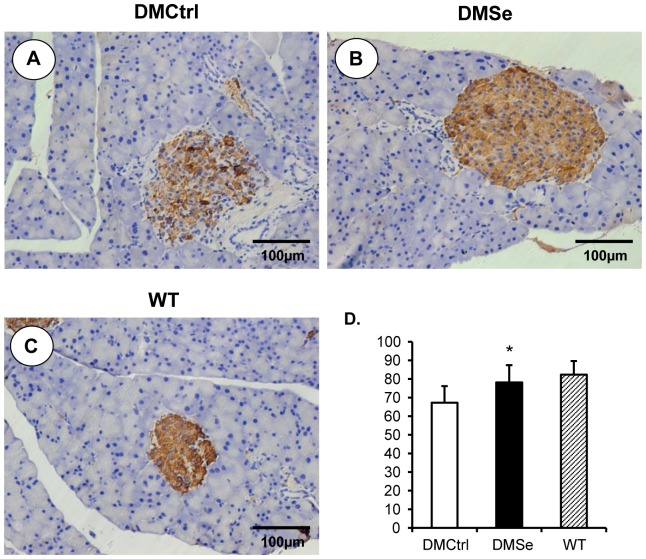
Figure 3. Immunohistochemical analysis to measure the production of insulin.
Positive cells displayed brownish yellow granules in the cytoplasm. (A) Although islet size was increased in DMCtrl mice, the relative positive rate of insulin expression was decreased as compared with WT mice (C). (B) Selenate treatment relieved the decline and maintained a similar levels of insulin expression in both DMSe mice and WT mice. (D) The insulin positive ratios of cells were measured and calculated using Image-Pro Plus software v. 6.0 (Media Cybernetics, Washington, USA) from more than 100 islets randomly selected in five fields for every pancreatic slice of each experimental group. The asterisk (*) represents significant differences (*P<0.01) between the DMSe group and DMCtrl group.

