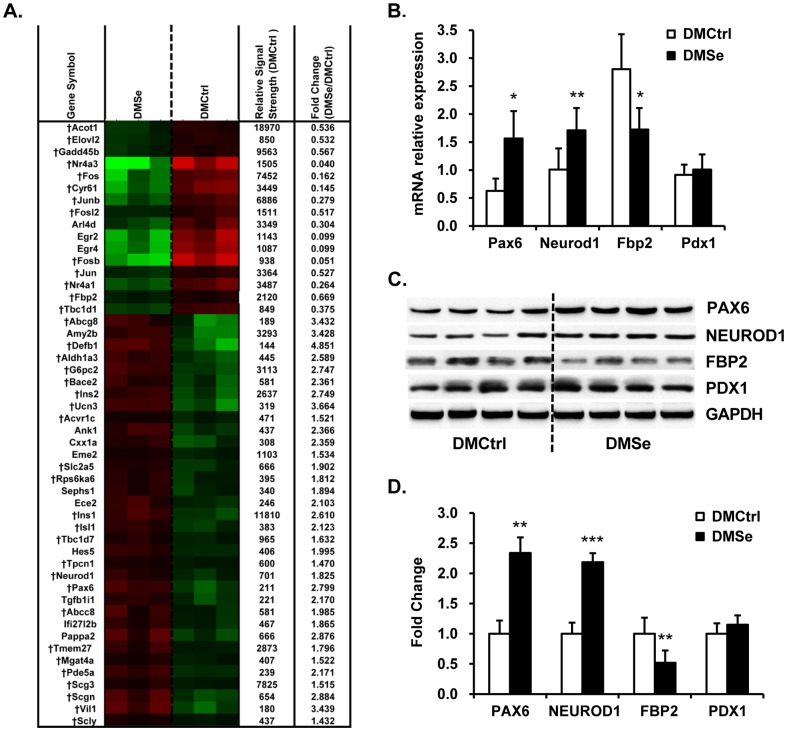
Figure 4. Pancreatic-specific genes and proteins differentially expressed in db/db mice.
(A) Heat map showing differences in the mRNA expression levels (green, lower; red, higher between DMCtrl and DMSe groups). The (†) indicates genes that are closely linked to key pancreatic β-cell functions or the development of diabetes. The relative signal strength represents the mean gene expression value in the DMCtrl group derived from Robust Multi-Array analysis. (B) qRT-PCR analysis of Pax6, Neurod1, Fbp2, and Pdx1 expression was used to validate the cDNA microarray data from the pancreas. There was strong consistency between the two assays. Three replicates were performed for each mouse (eight mice per group). Gapdh was used as an internal reference gene. The results are presented as the relative changes in mRNA expression levels in DMSe vs. DMCtrl mice. (C) Representative western blots and (D) quantitation of the levels of PAX6, NEUROD1, FBP2 and PDX1. GAPDH was used as an internal reference. Protein band intensity was quantified using densitometry using Gel-Pro Analyzer software v. 4.1 (Media Cybernetics, Washington, USA), and the results are presented as the ratio of densitometric values from DMSe to DMCtrl. The asterisk (*) represents values shown to be significantly different from DMCtrl by the Student t test (*P<0.05, **P<0.01, ***P<0.001).

