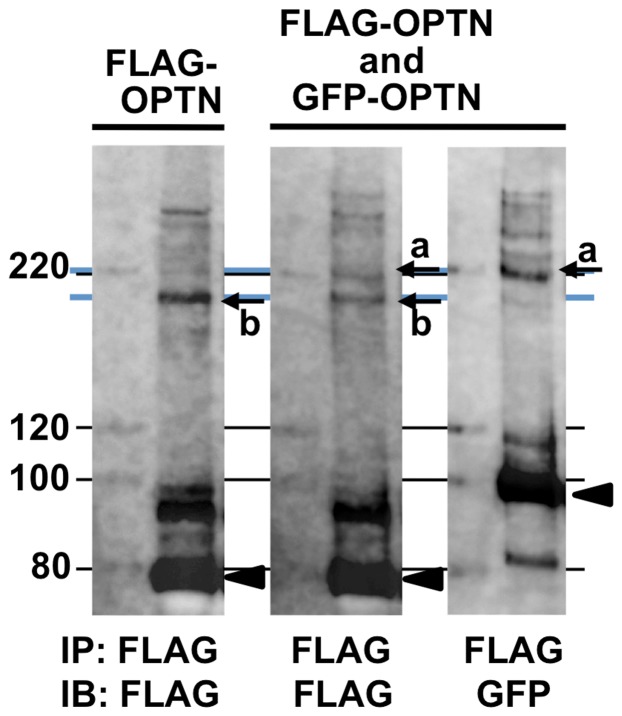
Figure 4. Higher resolution analysis of covalently bonded optineurin oligomers produced by co-transfection of FLAG-OPTN and GFP-OPTN.
NIH3T3 cells expressing FLAG-OPTN, or both FLAG-OPTN and GFP-OPTN, were treated with H2O2. Cell lysates were immunoprecipitated with anti-FLAG antibody and subjected to SDS-PAGE, on a 7.5% acrylamide gel, followed by western blotting with anti-FLAG or anti-GFP antibodies. In co-transfected cell lysates, the anti-FLAG antibody detected two bands (middle panel, arrows a and b), while the anti-GFP antibody detected only the higher molecular weight band (right panel, arrow a). In lysates of cells transfected with FLAG-OPTN alone, only the lower molecular weight band was detected (left panel, arrow b). OPTN monomer bands are shown as arrowheads. The blue lines were drawn as a guide to each of the corresponding H2O2-induced bands. NIH3T3 cells expressing FLAG-OPTN were treated without or with H2O2. IB: immunoblotting; IP: immunoprecipitation.

