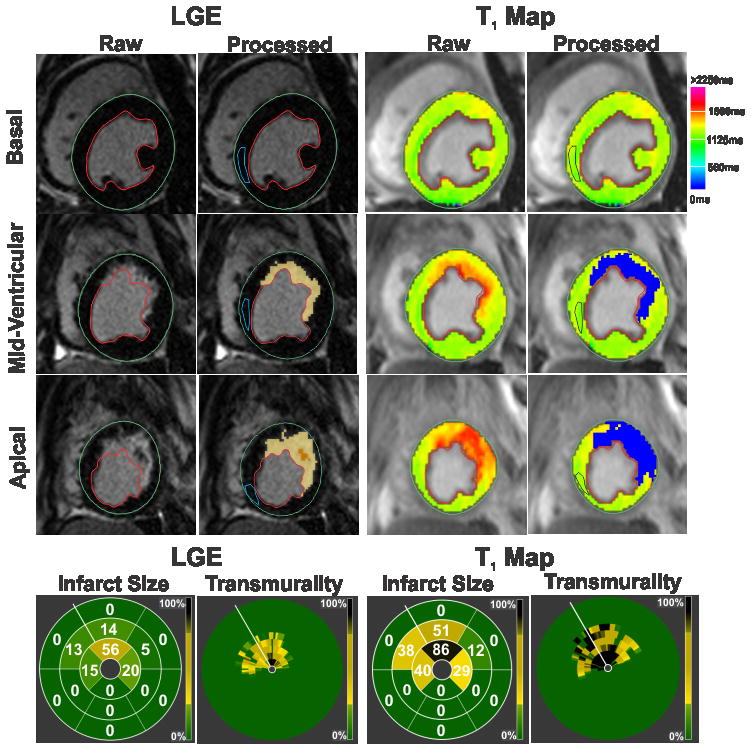
Figure 1. Detecting acute myocardial infarction at 3T.

Representative LGE images and T1 maps of basal, mid-ventricular and apical slices acquired at 7 days post MI from a canine scanned at 3T are shown. Infarcted myocardium (highlighted blue pixels in the processed images) was identified on both LGE images and T1 maps using the mean+5SD criterion with respect to the reference ROI drawn in remote myocardium (blue contour). Bulls-eye plots depicting the extent and transmurality of the infarcted myocardium are also shown for both LGE images and T1 maps. The number within each segment indicates the percentage volume of that segment that was detected as infarcted myocardium by the mean+5SD criterion. For transmurality, each slice was divided into 100 equally spaced chords with the first chord placed at the anterior insertion of the RV into the LV. Each concentric ring on the Bulls-eye plot represents each short-axis slice with the most basal slice represented by the outermost ring.
