
Figure 2. Diagnostic performance of native T1 maps for detecting acute myocardial infarction at 3T.
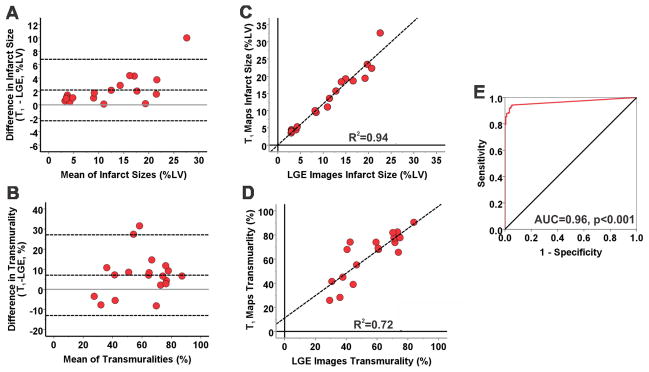
Bland-Altman analysis showed good agreement between LGE images and T1 maps for measuring infarct size (A) and transmurality (B) in AMI at 3T. T1 maps modestly overestimated infarct size and transmurality compared to LGE images. There were also strong correlations between LGE images and T1 maps for measuring infarct size (R2=0.94, C) and transmurality (R2=0.72, D). ROC analysis showed that area under the curve was 0.96 (E) indicating a strong diagnostic performance of native T1 maps for detecting AMI at 3T.