
Figure 3. Detecting chronic myocardial infarction at 3T.
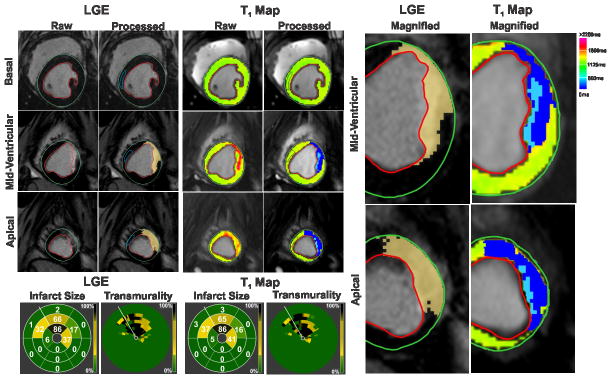
Representative LGE images and T1 maps of basal, mid-ventricular and apical slices acquired at 4 months post MI from a canine scanned at 3T are shown. Infarcted myocardium (highlighted dark blue pixels in the processed images) was identified on both LGE images and T1 as in Figure 1. Hypointense core of chronic iron deposition within the hyperintense infarcted myocardium was not detected as infarcted myocardium by the mean+5SD criterion, and was manually included in the final analysis (highlighted light blue pixels in the processed images). Bulls-eye plots depicting the extent and transmurality of the infarcted myocardium are also shown for both LGE images and T1 maps. Excellent correlations were observed between LGE images and T1 maps in terms of the location, spatial extent and transmurality of the infarcted myocardium. Magnified views (on the right) of the infarcted myocardium detected on the mid-ventricular and apical slices clearly show the concordance between LGE images and T1 maps.