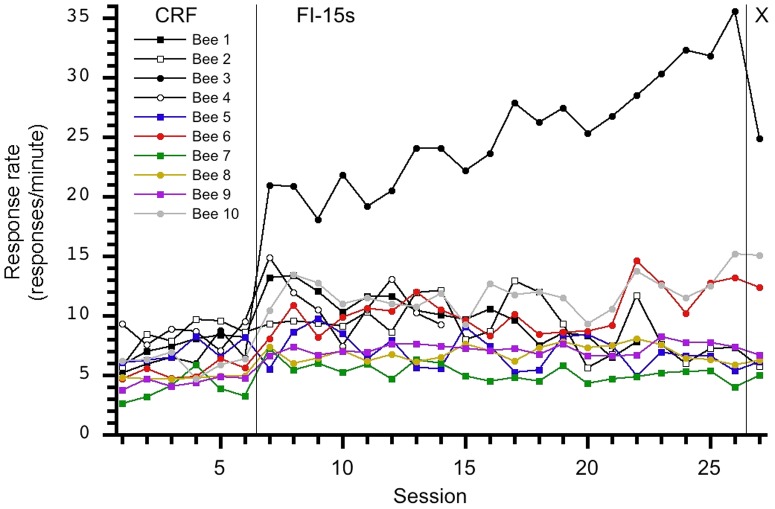
Figure 3. Individual response rates per session for the 0-15-X group.
Bee 3′s response pattern clearly differs from the other nine subjects; this relatively high response rate affected the group average performance as depicted in Figure 1. A sudden, yet small, increase in response rate is observed during the transition from CRF to FI-15s, and responding was maintained at a relatively uniform response rate on the FI schedule.

