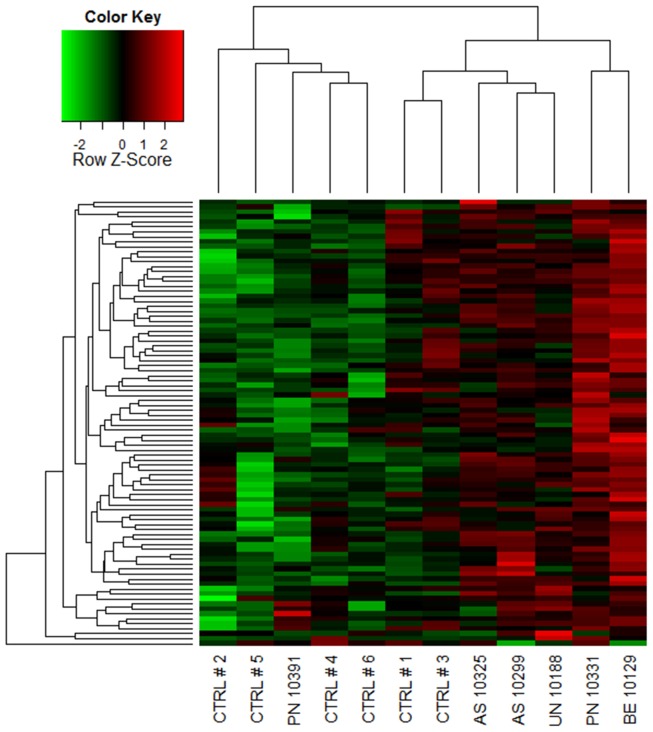
Figure 3. Module # 1 was upregulated at ED arrival in a subset of the anaphylaxis patients.
Network analysis was employed to identify gene coexpression modules in PBL responses during acute anaphylaxis. The heatmap illustrates the expression of module # 1 at ED arrival for individual patients and controls. Hierarchical cluster analysis was employed to cluster genes and samples based on the similarity of their expression patterns. (PN – peanut anaphylaxis, AS – aspirin anaphylaxis, BE – bee anaphylaxis, UN – unknown anaphylaxis, CTRL – healthy control).

