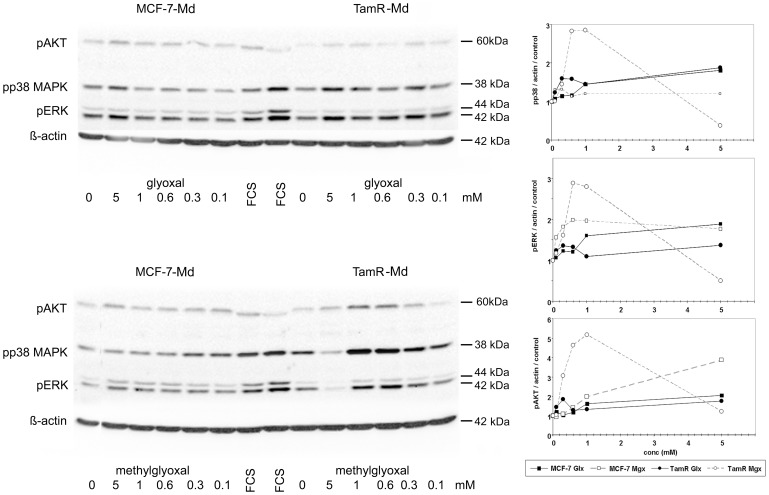
Figure 5. Kinase phosphorylation in MCF-7-Md and TamR-Md cells in response to glyoxal and methylglyoxal.
Confluent and serum starved cells were incubated with different concentrations of dicarbonyls for 10 minutes before proteins were extracted and subjected to Western blot analysis. Experiments were repeated three times in duplicate. A representative Western blot and the quantification of the signals of all experiments are shown. Band intensity was expressed relative to the β-actin signal and control treatments were set to 1 for each cell-line.

