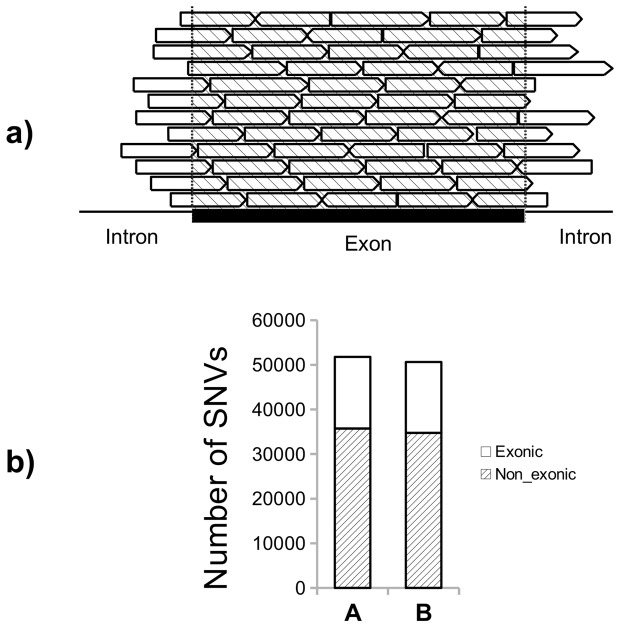
Figure 1. SNVs found in blood for individuals A and B.
a) Scheme showing how flanking intronic sequences can be detected in exome sequencing. The capture of exonic reads includes intron regions at both ends of the exons. b) Total number of SNVs found in blood from subjects A and B. The annotation software of SNVs (see materials and methods) classified these variations as exonic and non-exonic. For the aims of this work, we considered only exonic variations.

