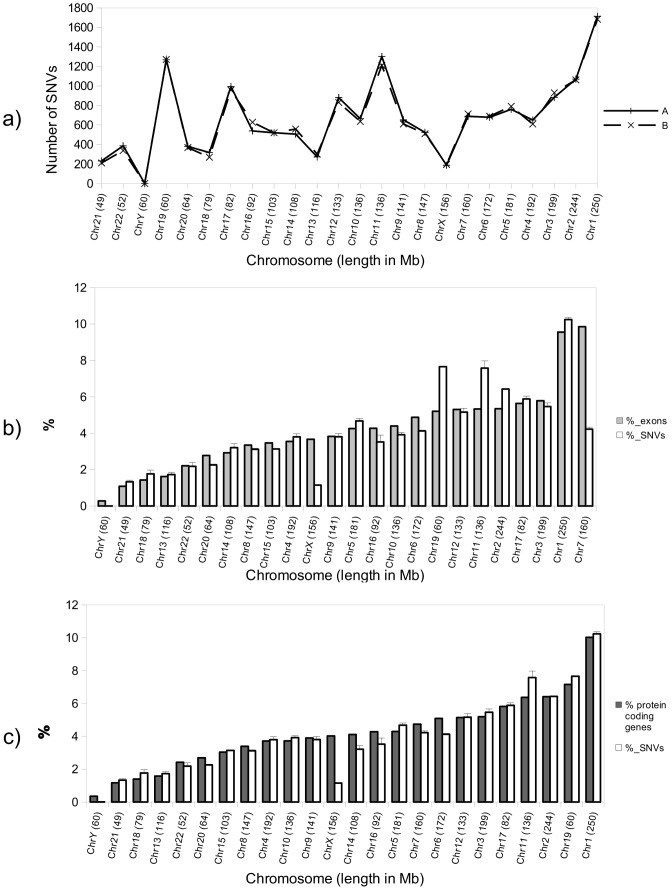
Figure 2. Number and distribution along the chromosomes of blood exonic SNVs.
a) Total number of exonic SNVs found in blood for each chromosome for subjects A and B. The chromosomes are sorted by size in Megabases from low to high. No correlation is appreciated between the length of the chromosome and the number of SNVs found in each case. b) White bars represent the percentage of SNVs per chromosome with respect to the total SNVs found in blood for subjects A and B. Gray bars indicate the percentage of exons (with respect to the number of total exons in the human genome [21]) for each chromosome. Bars were sorted in this case from lower to higher number of exons/chromosome. There seems to be a certain correlation between the number of exons and the number of SNVs per chromosome, with some exceptions, mainly for chromosomes 7, 2, 11, 19 and X. Error bars indicate the standard deviation of the measurements. c) As in b), white bars show the average of the percentage of total SNVs in each chromosome for subjects A and B, but in this case gray bars indicate the percentage of protein-coding genes with respect to the total number in the human genome[21]. Bars were sorted from lower to higher number of protein-coding genes/chromosome. Error bars indicate the standard deviation of the measurements.

