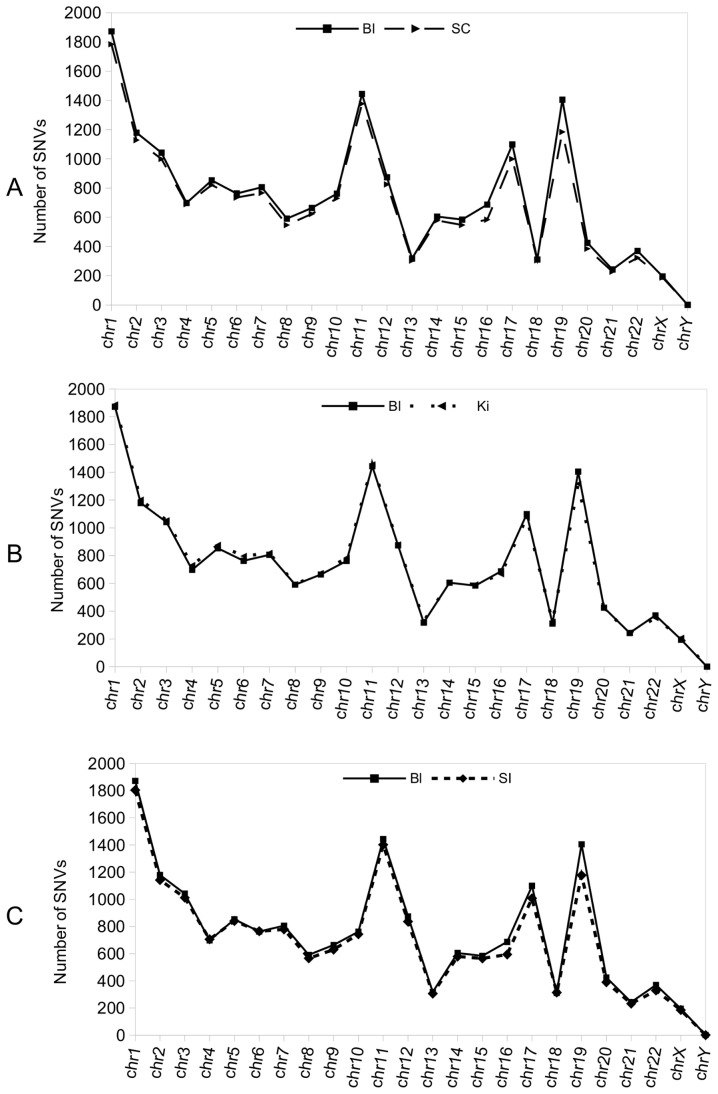
Figure 6. Number of total exonic SNVs found for each chromosome in tissues from subject C compared with blood.
a) Exonic SNVs per chromosome found in a representative tissue of ectoderm origin, namely the spinal cord (SC), compared with those of blood (Bl). b) As in a) total blood exonic SNVs per chromosome are shown, but in this case they are compared with the number of SNVs present in a representative tissue of mesoderm origin, namely the kidney (Ki). c) Representation of the number of total exonic SNVs per chromosome found in a representative tissue of endoderm origin, namely small intestine (SI), compared with those of blood (Bl).

