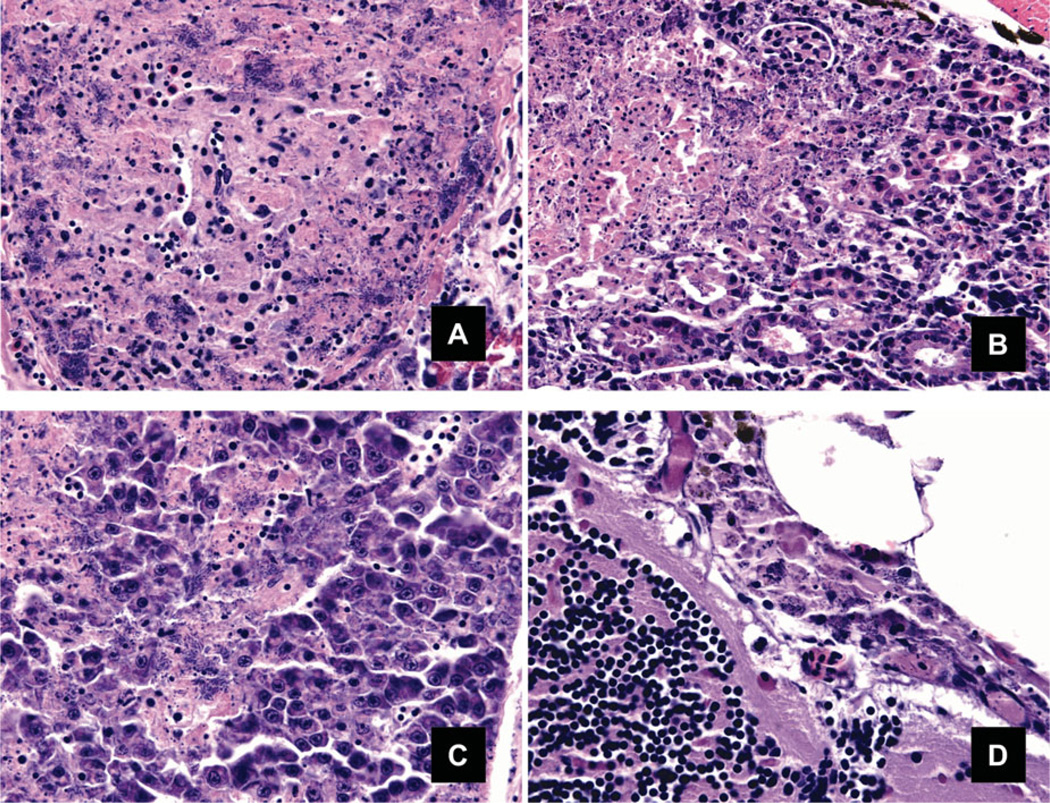
FIGURE 4.
(A) The spleen exhibits necrosis in more than 95% of the parenchyma with numerous necrotic macrophages and innumerable rod-shaped bacteria within and between cells. Pancreatic exocrine tissue is present at lower right. (B) Areas of inflammation and necrosis were evident in the kidney as discrete expansive foci with progression of severity preferentially affecting hematopoietic cords prior to nephron necrosis. In the left of the image many small shrunken pyknotic cells and karyorrhectic debris (necrosis) are evident admixed with many bacteria. (C) The liver contains several foci of necrosis with numerous bacteria. (D) The endomeninges are expanded two to three times their normal size by aponecrotic leukocytes and bacteria. The brain is at lower left of the image, pericephalic adipose at upper right (400×).

