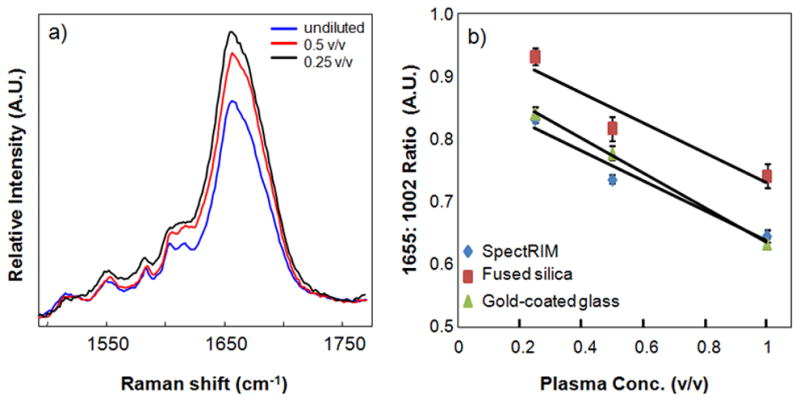
Figure 6.

Plasma concentration had an effect on the relative intensity of the amide I envelope of the Raman spectrum, here measured by the 1665 cm−1: 1002 cm−1 intensity ratio. Unexpectedly, the ratio increased in more dilute samples (panel a). This pattern was observed independent of substrate (panel b).
