
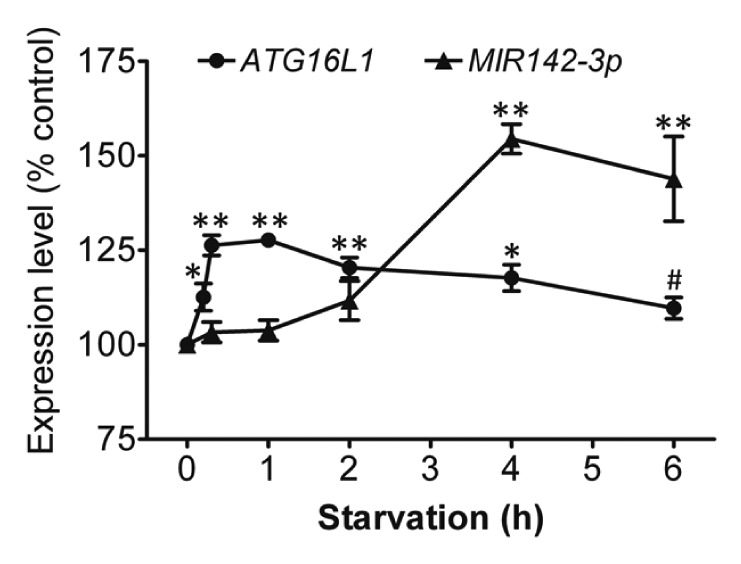
Figure 9. Starvation coinduces ATG16L1 and MIR142-3p. HCT116 cells were incubated in EBSS for different time points (0 to 6 h), then the relative expression levels of ATG16L1 mRNA and endogenous mature MIR142-3p were assessed by qRT-PCR and normalized with GAPDH and RNU6B, respectively. The expression levels of both ATG16L1 and MIR142-3p for the unstarved controls are considered as 100%. The data are expressed as the mean ± SEM (n = 3). *P < 0.05 and **P < 0.01 vs the corresponding unstarved control. #P < 0.05 vs the ATG16L1 mRNA expression at 1 h.