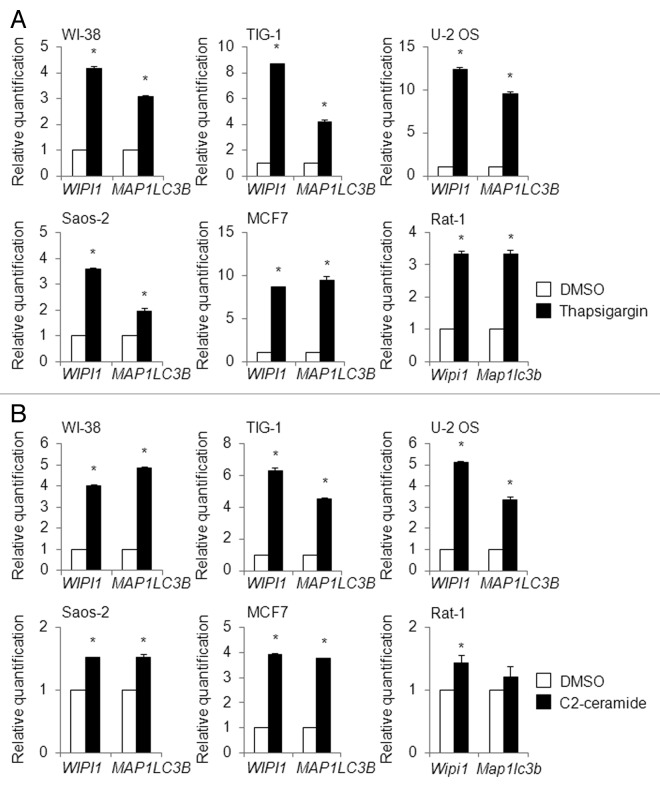
Figure 13.WIPI1 and MAP1LC3B mRNA levels in various cell lines. WI-38, TIG-1, U-2 OS, Saos-2, MCF7, and Rat-1 cells were treated with 0.5 µM of thapsigargin (A) (black bar), 100 µM of C2-ceramide (B) (black bar), or DMSO (white bar) for 12 h, and a quantitative RT-PCR analysis was performed to determine the WIPI1 and MAP1LC3B mRNA levels. The bars indicate the means ± SDs. *P < 0.05 (n = 2 and n = 4 for human cell lines and Rat-1 cells, respectively).

An official website of the United States government
Here's how you know
Official websites use .gov
A
.gov website belongs to an official
government organization in the United States.
Secure .gov websites use HTTPS
A lock (
) or https:// means you've safely
connected to the .gov website. Share sensitive
information only on official, secure websites.
