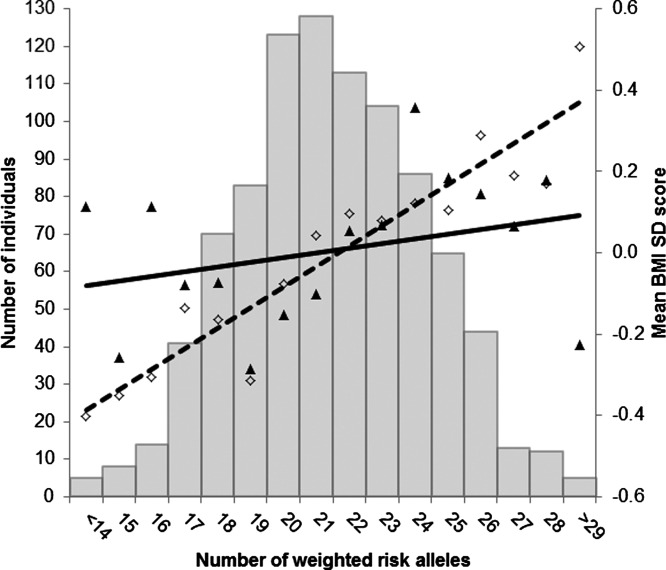
Figure 1.

Regression of mean age- and sex-adjusted BMI-SDS values at ages 4 and 10 years across the risk-allele scores. The histogram shows that the number of weighted obesity risk alleles was normally distributed in the sample. The solid black triangles show the mean age- and sex-adjusted BMI-SDS values at age 4 across the weighted risk-allele scores; the black diamonds show the mean age- and sex-adjusted BMI-SDS values at age 10 across the weighted risk-allele scores. The solid black line shows the regression line for age- and sex-adjusted BMI-SDS at age 4 predicted from the PRS (R2 = 0.010; 95% CI: 4.3 e−09 to 0.042; P = 0.002). The dashed line shows the regression line for age- and sex-adjusted BMI-SDS at age 10 predicted from the PRS (R2 = 0.034; 95% CI: 0.009-0.093; P < 0.001).
