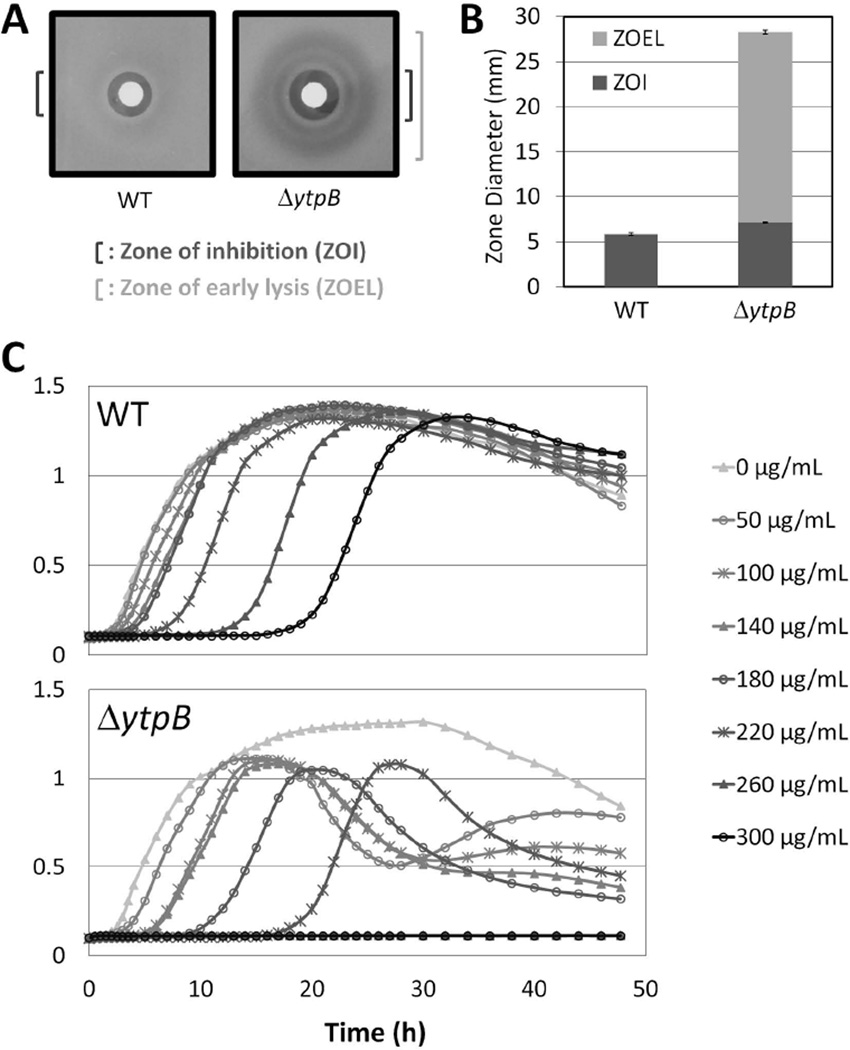
Figure 2.
Bacitracin sensitivity of the ΔytpB strain. (A) Sample image of a bacitracin disk diffusion assay with WT (168) and ΔytpB (HB13321) cells on MH medium. The zone of inhibition (ZOI) and the larger zone of early lysis (ZOEL) are designated by dark and light brackets, respectively. (B) Graphical depiction of the disk diffusion assay from panel A. For this and subsequent graphs, the y-axis shows the ZOI, expressed as total diameter (in millimeters) minus the diameter of the filter paper disk (5.5 mm) with the ZOEL depicted in lighter shade above the ZOI when it was present. Each bar represents the average from at least three assays performed with three independent clones of each strain, with error bars representing standard error. Statistically significant differences in zone of inhibition were determined with a Student's t-test (P < 0.05). (C) Representative growth curve assay of WT (168) and ΔytpB (HB13321) cells in the presence of bacitracin at the concentrations indicated.

