
Figure 2.
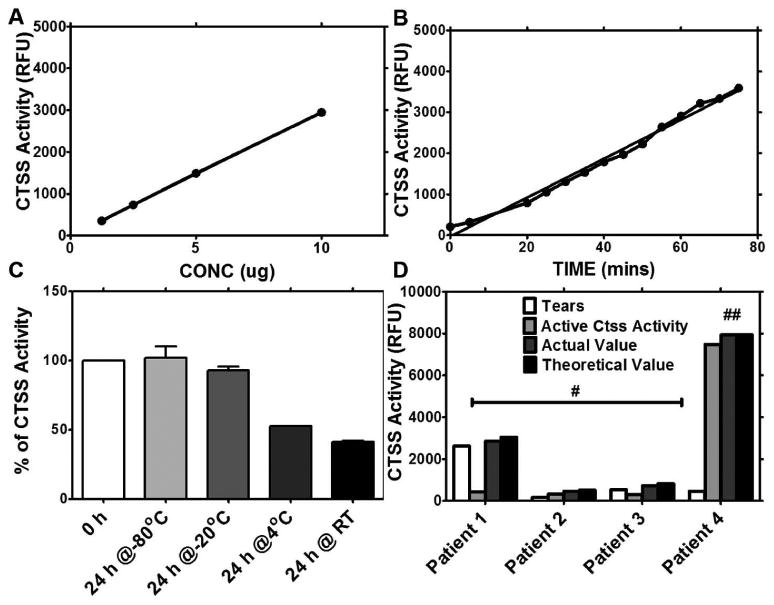
Validation of CTSS activity. (A) Relationship of CTSS activity versus time. (B) Relationship of CTSS activity versus concentration. (C) CTSS activity at different storage temperatures. Data are presented as percentage of CTSS activity analyzed immediately after collection (0 hours). Error bars represent SD. (D) Representative results of CTSS activity in the presence of native proteins present in tears from 4 patients. Actual value is the amount of CTSS activity obtained when a given amount of active CTSS was added to patient tears. The theoretical value is the sum of CTSS activity obtained from tears and active CTSS individually. # represents samples in which 2.5 μg of active CTSS protein was added to patient tears while ## represents samples in which 25 μg of active CTSS to was added to patient' tears.